News
Global Tomato Juice Trade
The global tomato juice market today accounts for about 100,000 metric tons of product each year, with a total value close to 87 million US dollars. The main players in the sector are European, and to a lesser extent, from the United States and Turkey.
Over the past seven years, annual international trade in tomato juice (under HS codes 200950, tomato juice with a dry weight content of less than 7%) has involved between 90,000 and 100,000 metric tons of finished products.
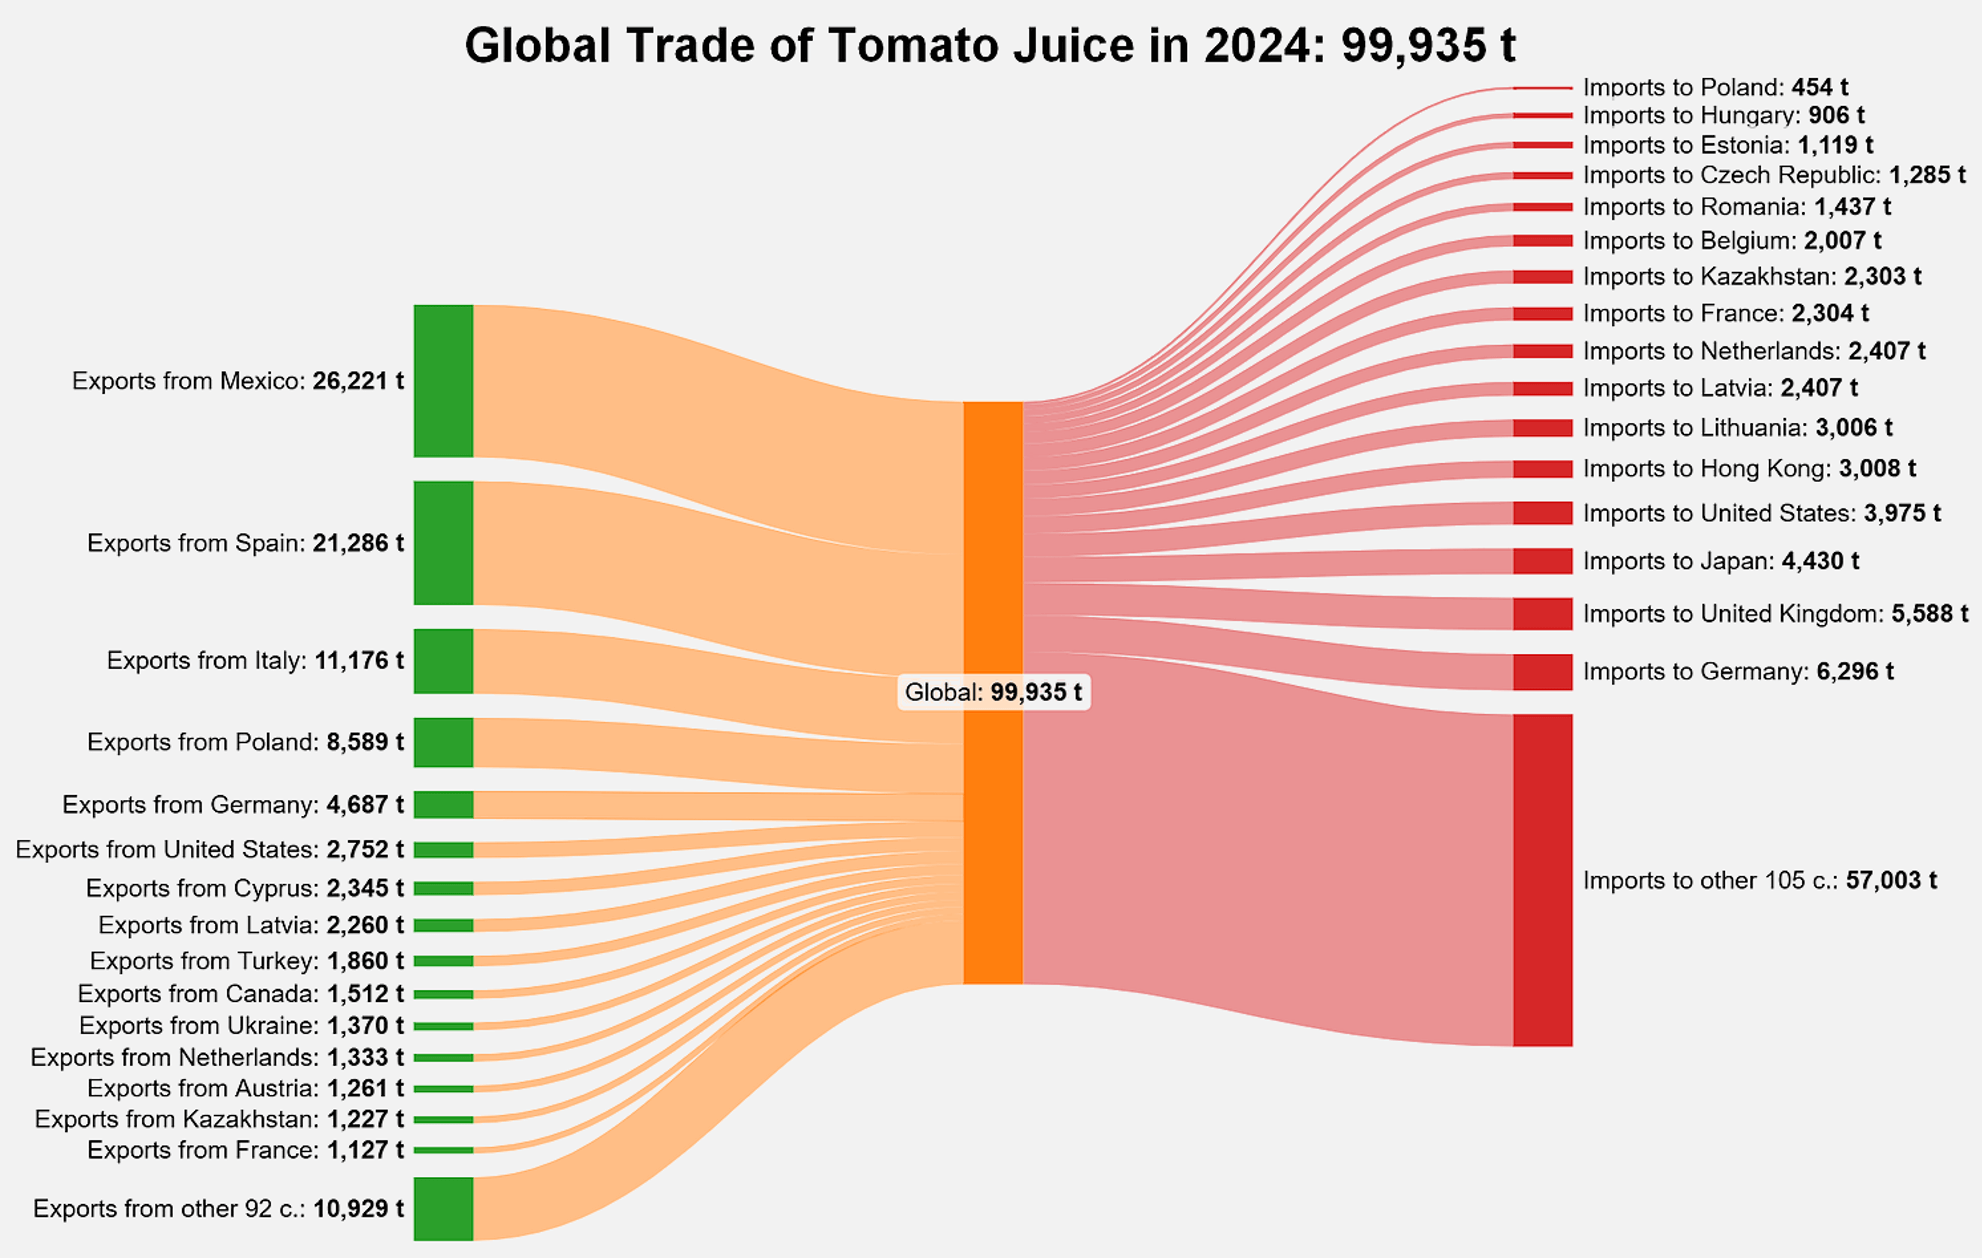
The quantities exported in 2024 amounted to 99,935 metric tons, an increase of 11% compared to 2023 and 9% compared to the average of the three preceding years (2021-2023). You have to go back to 2013 and 2014 to see higher figures (around 104,000 metric tons). Before these dates, the global juice market grew relatively quickly, from 40,000-45,000 metric tons per year in the early 2000s to 105,000 metric tons in 2013. After these historical quantities, annual tomato juice trade significantly decreased before gradually returning to around 100,000 metric tons last year.

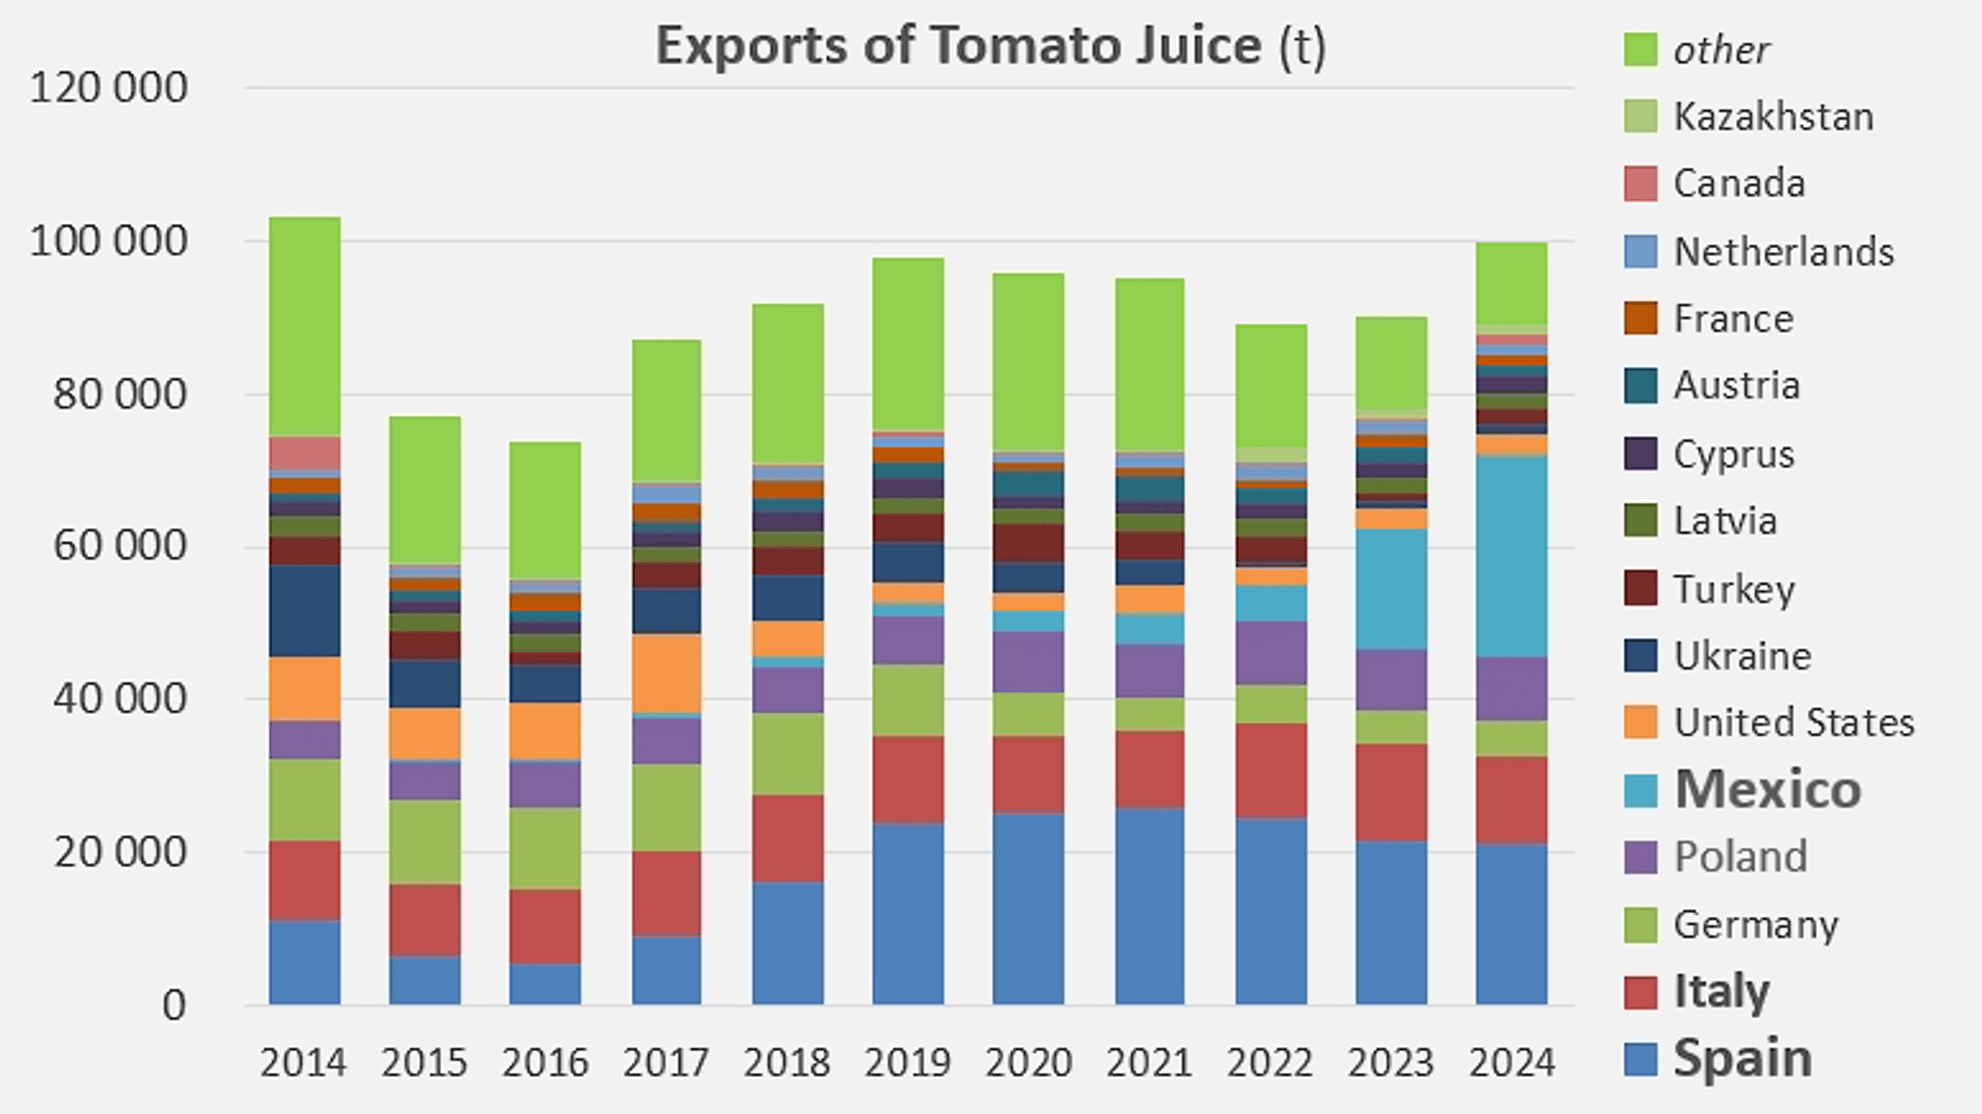
Data collected from national customs services show that the main historical supply hubs for the sector are Spain (about a quarter of global volumes over the last seven years), Italy (12%), and Poland (8%). In recent years, tomato juice exports from Mexico have emerged, quickly gaining a foothold in the market and representing 26% of global trade last year. The United States, Ukraine, and Turkey are also regular exporters in this sector.
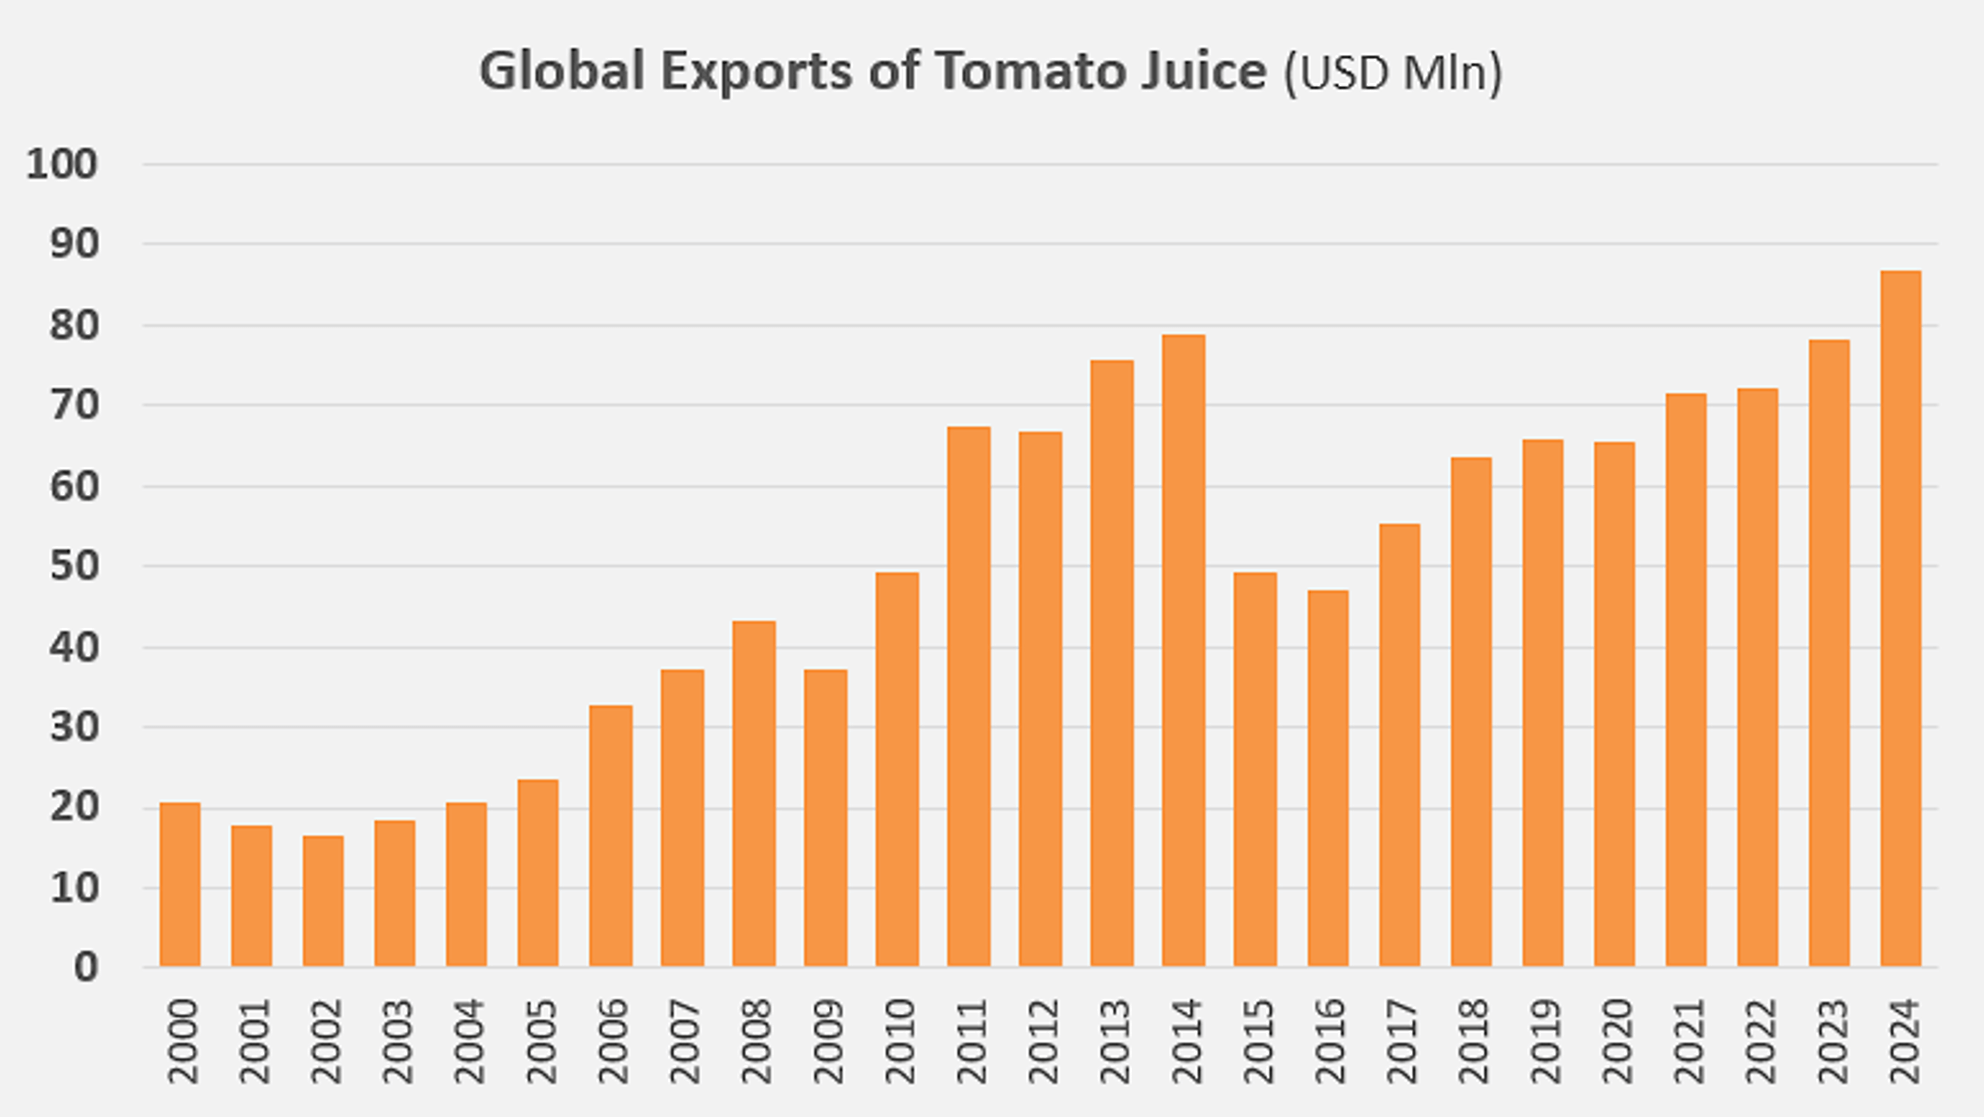
After a fairly rapid increase in recent years (see complementary data at the end of the article), the total market value reached nearly 87 million USD. This latest growth phase, which began in 2015, followed another even faster phase that started in the early 2000s and was abruptly interrupted in 2014.
As suggested by the geography of the processing/export hubs and import statistics, the largest consuming countries belong to the European markets (EU and non-EU). Germany, the United Kingdom, Lithuania, Latvia, the Netherlands, France, and Belgium, to name just the most important, accounted for 58% of the quantities traded globally last year. However, it is important to note that the weight of European countries was much greater in the past, especially during the 2014-2020 period when Europe, in the broad sense, imported nearly three-quarters of the globally traded volumes. Among other notable tomato juice importing countries in recent years, Hong Kong, Kyrgyzstan, Kazakhstan, and South Korea should also be mentioned.
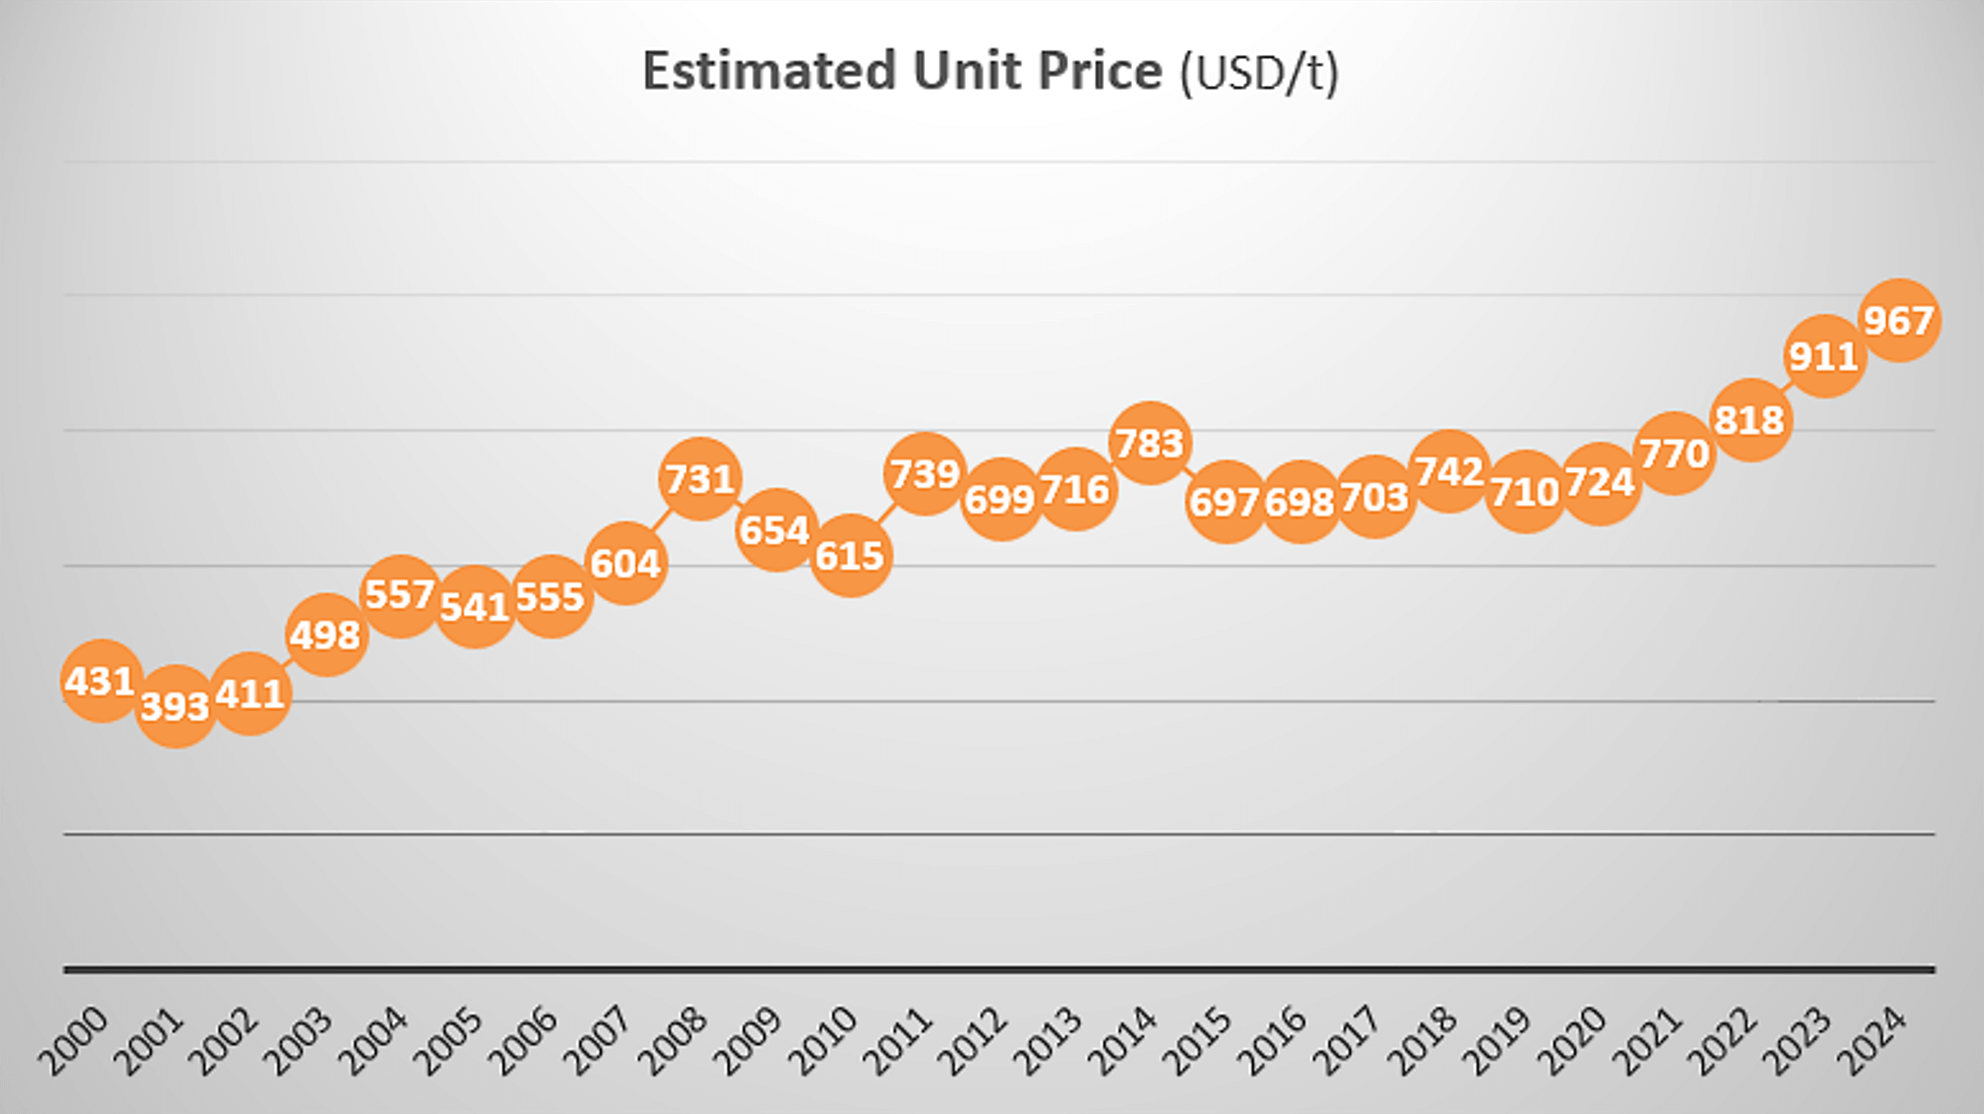
The average indicative value of a metric ton of tomato juice on the global market, estimated independently of contract, quality, and delivery terms, has increased significantly over the last twenty-five years, rising from approximately $430 per metric ton in 2000 to nearly $967 in 2024 (CAGR 3.4%).
Some complementary data
Evolution of the total value of annual tomato juice exports (HS codes 200950) since 2000.
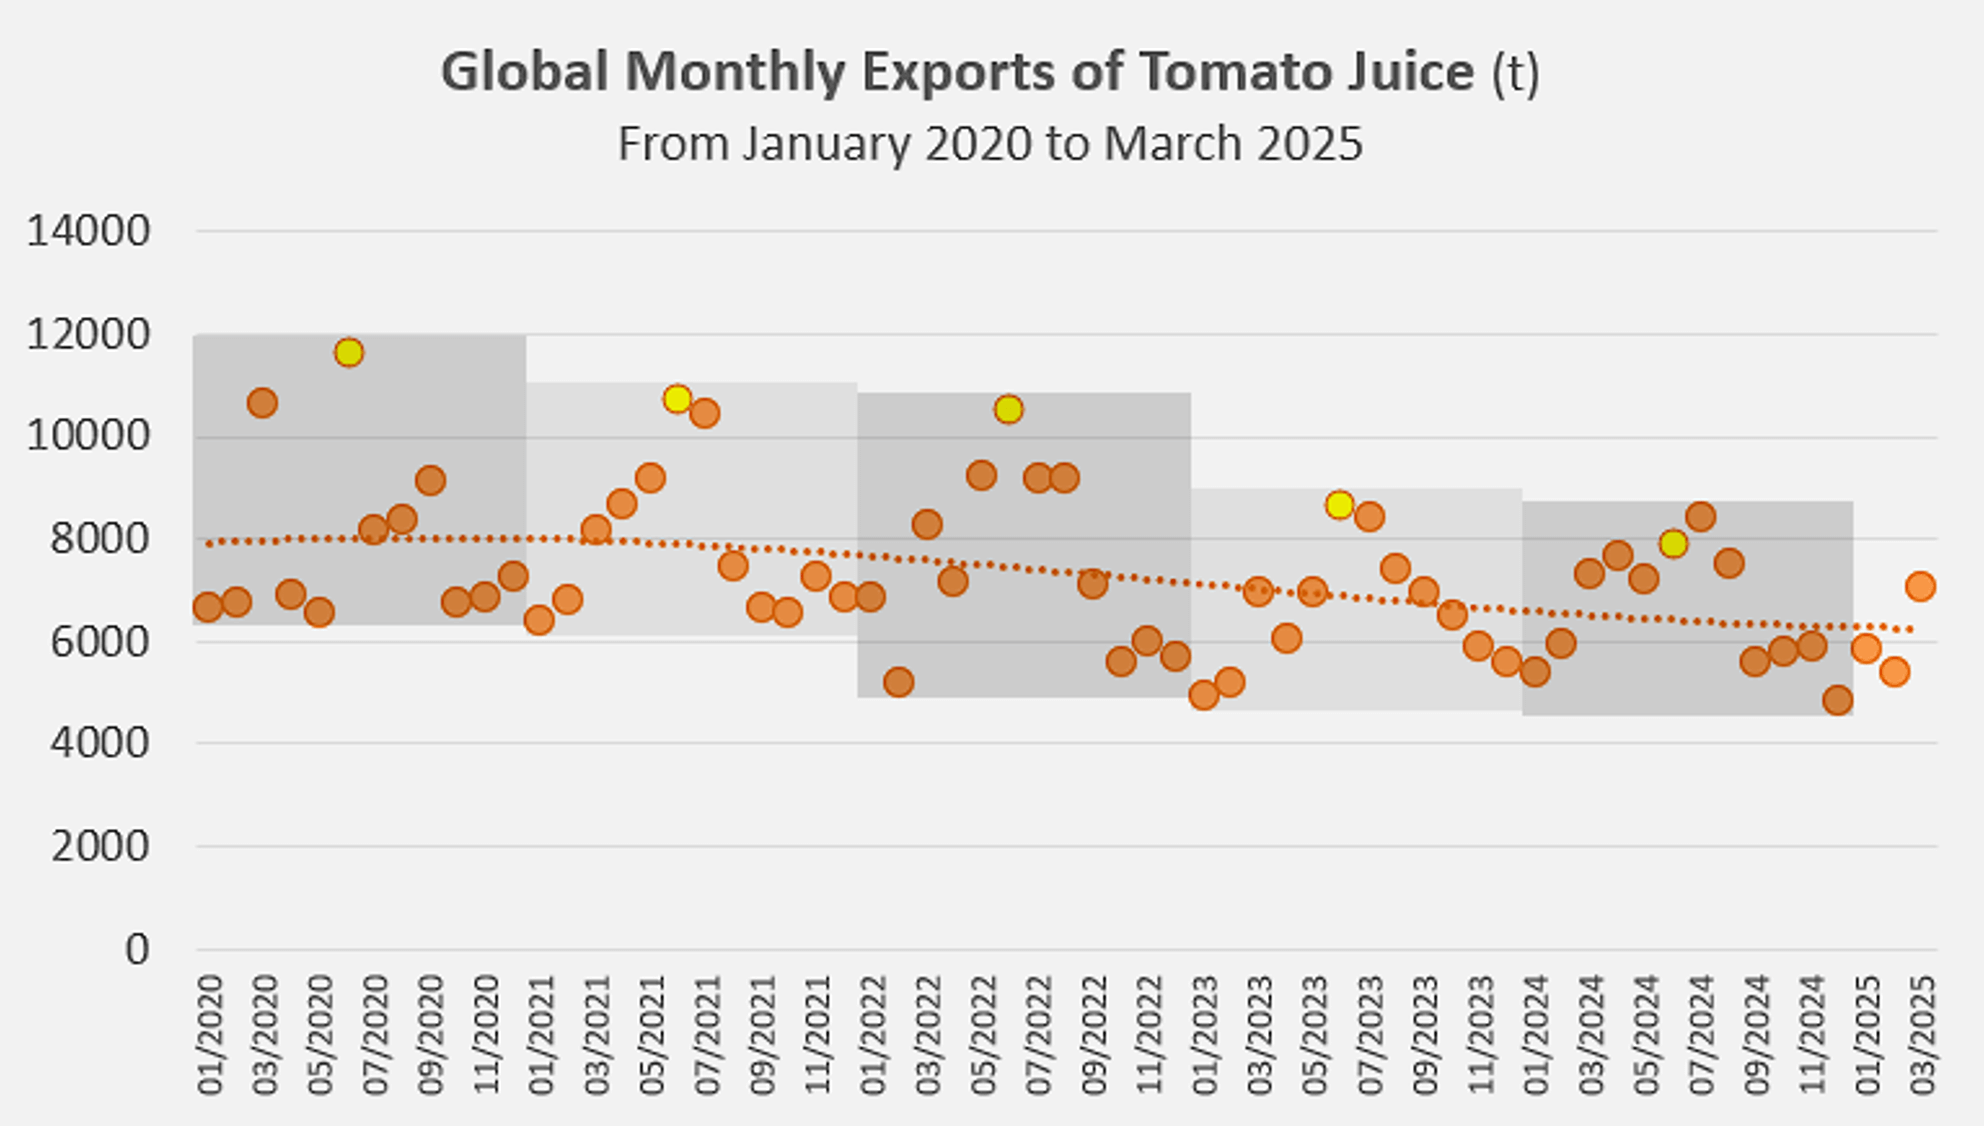
Global monthly tomato juice exports have shown a declining trend for several years.
Source: TDM


