News
Trade
Interactive graph: Evolution of total tomato paste export by individual country (2006/07 to 2025/26)
You can change the country selection by selecting one or several countries of interest below the graph.
By default, the countries displayed are the TOP 10 countries during the last Marketing Year.
2025: Global Trade Architecture for Tomato Products
In 2025, the tomato paste market experienced slower volume growth. This quantitative slowdown contrasts with the sharp “value shock” of recent years, where revenue surged due to rising input costs (energy, packaging) rather than increased quantities. This disconnect creates a squeeze, where real profitability now depends on the ability to pass on these record production costs rather than on simple agro-industrial performance.
Analysis of global tomato paste exports (customs code 200290) over the last twenty-five marketing years reveals solid, if not consistent, overall growth, which increased annual volumes from 1.17 million metric tons (t) in 2000/2001 to around 3.86 million t for 2024/25. This tripling of the market was not, in fact, linear: from 2000/2001 to 2012/2013, the sector experienced a phase of rapid and sustained expansion, characterized by a compound annual growth rate (CAGR) of approximately 6%. These first twenty years were marked by massive industrialization of the main processing countries and an opening up to new consumer markets in Africa and Asia, followed by a phase of sluggish growth after 2013/2014.
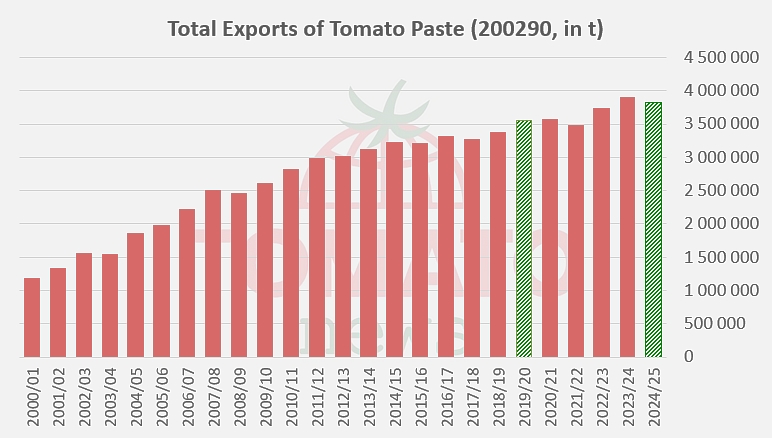
However, the momentum was severely disrupted during the following period, from 2018/19 to 2024/25. Momentarily “boosted” by the Covid effect, the rate of growth slowed considerably, returning to around 2% per year, signaling a market reaching maturity, where expansion no longer relies on the opening of new outlets, but on heightened competition, and where the performance of players depends on their logistical efficiency, their price competitiveness and their ability to manage the climatic hazards affecting the production areas. At the same time, the dominance of the top 12 processing/exporting countries is consolidating, with a market share threshold reaching 95% by 2025. This very high concentration makes the emergence of new competitors almost impossible in a commercial landscape where consumer habits evolve only slowly.
The global tomato paste market is currently going through a difficult period. While exports are increasing, the post-COVID period has generated a dramatic “value shock,” propelling prices to historic highs. This surge in prices, however, does not reflect increased profitability, but rather an explosion in production costs. The inflation of inputs (energy, pesticides, packaging) and transportation creates a squeeze that weakens the entire agri-food processing sector.
From now on, the sector’s survival no longer depends on the race for volume, but on the ability to secure resources and control energy efficiency. The strategic challenge becomes resilience in the face of volatility, rather than simple commercial expansion.
Global Tomato Paste Market Players in 2025
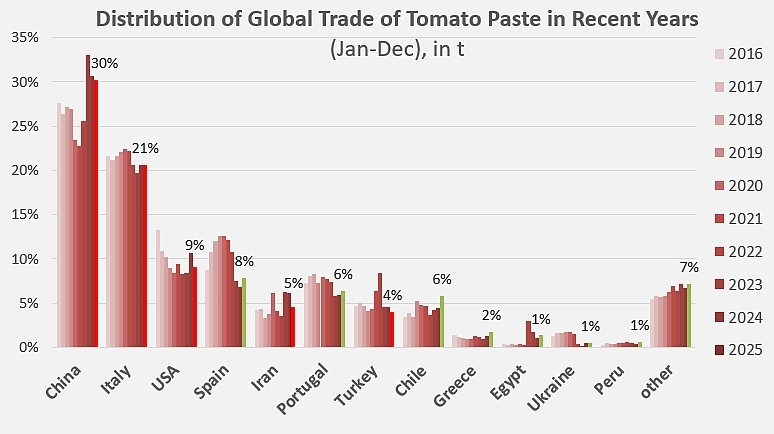
The global tomato paste market in 2025 is once again structured around a marked duality between China and Italy, which together control more than half of global flows with a combined volume of 1.96 million tons of finished products out of a total of 3.52 million tons. China has established itself as the undisputed leader with 1.17 million tons exported, representing approximately one-third of global supply. Its strategy relies on a massive presence in emerging countries, particularly in the Middle East and West Africa, two regions that absorb 326,000 and 314,000 tons of products, respectively. Conversely, Italy, the world’s second-largest exporter by 2025 with nearly 794,000 tons, concentrates its power on the European market. It is the leading supplier to Western Europe with nearly 428,000 tons, thus capturing more than 40% of imports to this region, which is also the most promising in the world with total demand exceeding one million tons (1.04 million tons).
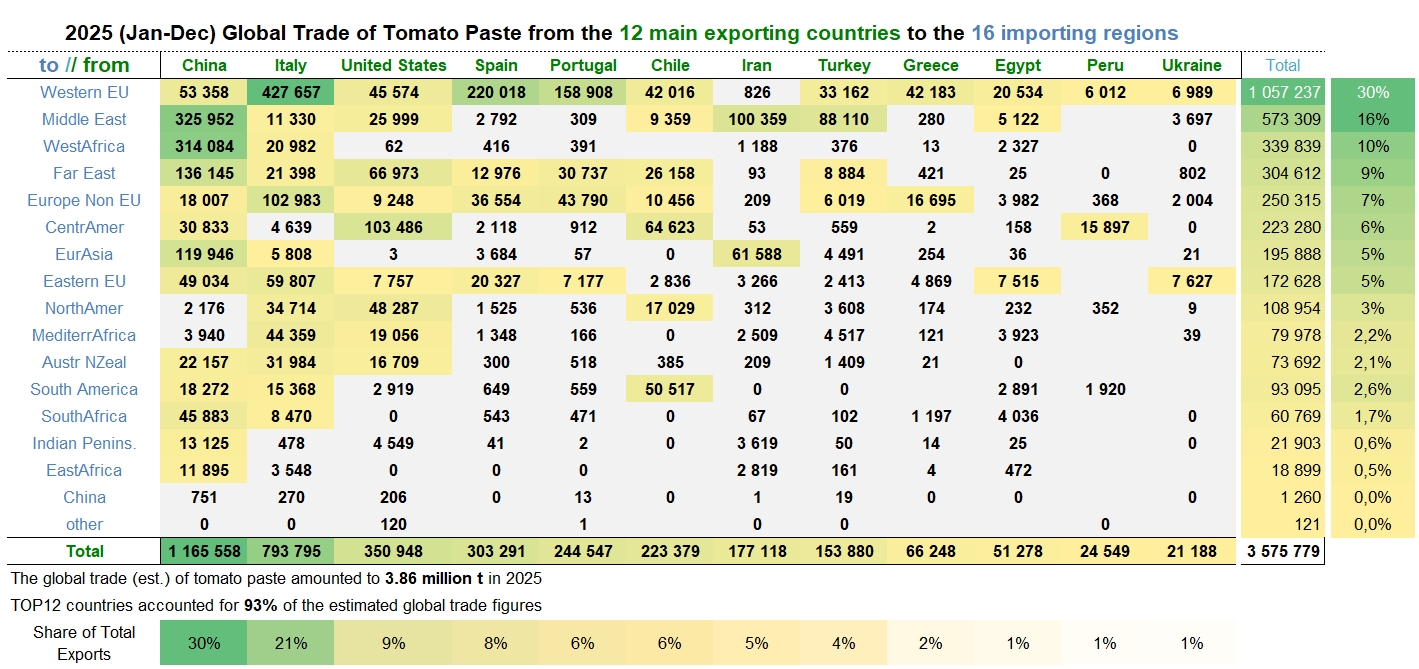
Behind these two leaders, the United States occupies a unique position with 350,948 tons, positioning itself as a key supplier to Central America (103,486 tons) and the Far East (66,973 tons). Spain and Portugal complete the European picture, exporting 303,291 and 244,547 tons respectively, destined almost exclusively for their Western EU neighbors. The consistency of certain specialized regional hubs is also evident: Chile dominates trade with South America with 50,517 tons, while Iran plays a strategic pivotal role for the Middle East (100,359 tons) and Eurasia (61,588 tons). Conversely, countries like Ukraine and Peru remain more modest players, with total volumes not exceeding 25,000 tons.
This configuration outlines a highly polarized geography of trade, where flows are dictated by geographical proximity for Western countries and by the conquest of large-volume markets for Asian production.
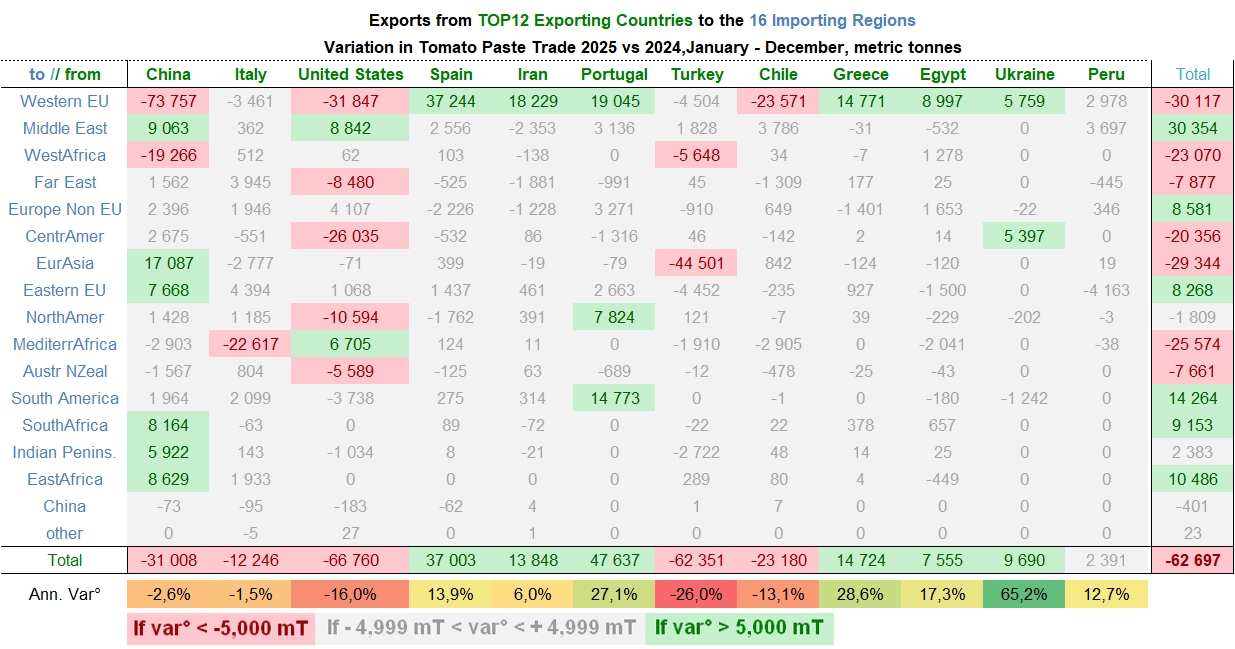
In 2025, the global market contracted by 70,250 tons, revealing stark disparities between established players and their challengers. Traditional leaders suffered the heaviest setbacks, illustrating the difficulties linked to rising production costs and a potential loss of competitiveness. The United States thus posted the most significant drop in volume, with a decline of 66,700 tons (-16%), abandoning its strongholds in Western Europe (-31,800 tons) and Central America (-26,000 tons). For its part, Iran recorded the worst relative performance with a 26% decrease, marked by a collapse of 44,500 tons in its flows to its natural market, Eurasia. Even China, while more stable overall (-2.6%), is making a major strategic shift by massively abandoning the Western European market (-73,700 t) to focus on the Eurasia (+17,000 t) and Middle East.
This reshuffling of the cards is benefiting new growth hubs, notably Chile, which has emerged as the year’s big winner with an increase of 47,600 t (+27.1%), as well as Spain (+37,000 t) and Portugal (+13,800 t). These players are leveraging their geographical proximity to partially offset the Chinese and American withdrawal from Europe, driven by shorter and more stable logistics chains. Regional demand reflects this restructuring: with a decline in its imports of over 39,000 t, Western Europe remains the area of greatest pressure, while the Eurasian, West African, and Mediterranean markets have contracted by over 29,200 t, 24,300 t, and 23,500 t, respectively. Conversely, the Middle East remains the only major region with robust growth, increasing by 30,886 t, ahead of South America, where foreign purchases rose by more than 14,000 t.
The decrease of 70,250 t in global total masks a harsher reality: the combined declines of the countries highlighted in red (USA, Iran, China, Turkey, Italy) amount to more than 195,000 t. If the overall market declined by “only” 2.6%, it is solely due to the exceptional performance of Chile and the Iberian countries, which are capturing market share left vacant by struggling leaders. This new situation confirms that commercial survival now depends on processors’ ability to secure their resources and control energy efficiency in order to pass on the soaring costs to the final price.
Global Canned Tomatoes Market Players in 2025
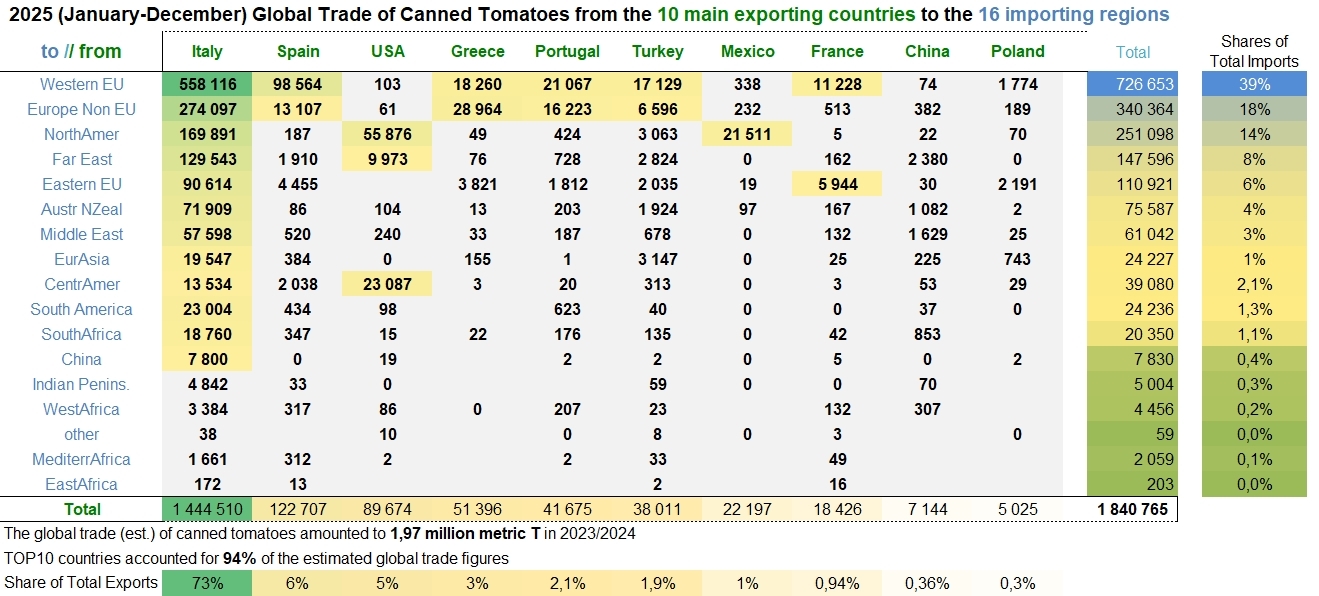
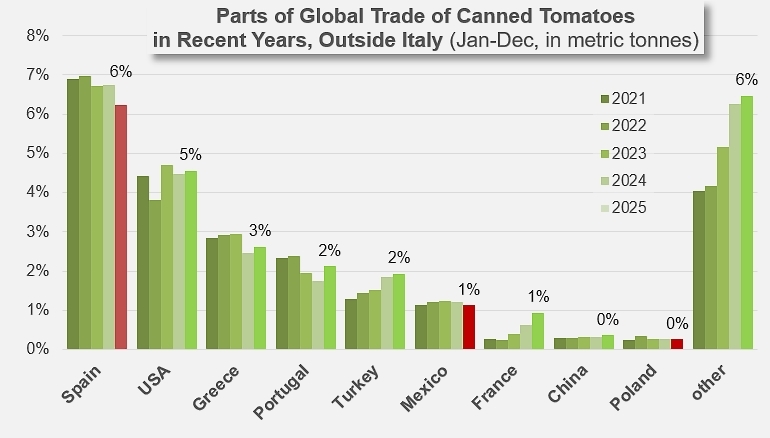
The 2025 results confirm Italy’s hegemony over the global market for canned tomatoes (HS codes 200210, peeled or unpeeled, whole or in pieces). With 1,444,510 metric tonnes (t) exported, Italy captures more than 73% of the total global volume (estimated at 1,968,000 t) and remains the leading supplier to each of the sixteen consuming regions. However, this dominant position is accompanied by a slight slowdown: the Italian leader recorded the largest net decrease among the top 10, with a drop of 16,700 t, which was particularly pronounced in distant markets such as the Far East and Oceania.
This slight Italian contraction, combined with that of Spain (the second-largest exporter with 122,700 t, but down by 10,600 t), has benefited mid-sized European players. On more modest volumes, Portugal and France showed the strongest growth dynamics, with gains of 7,300 t and 6,300 t respectively. Greece also followed this positive trend (+3,000 t), thereby consolidating the weight of the European bloc in global trade.
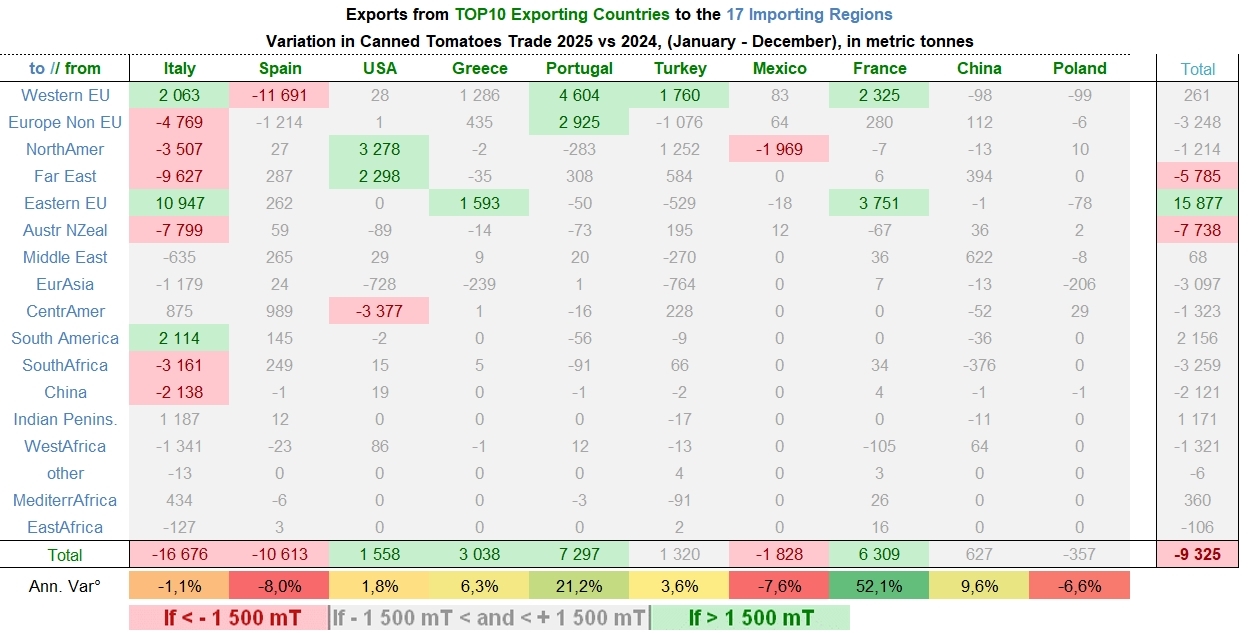
Geographically, the market remains highly polarized. Western Europe remains the primary consumption hub, with over 726,000 t absorbed, although its growth is stagnating. Conversely, Eastern Europe has emerged as the most dynamic growth driver of the year, with an import increase of 15,900 t, driven notably by Italian, Greek, and French flows.
The 127,200 t exported by countries outside the top 10 complete the 2025 global total in a market characterized by a slight rebalancing.
Global Tomato Sauces Market Players in 2025
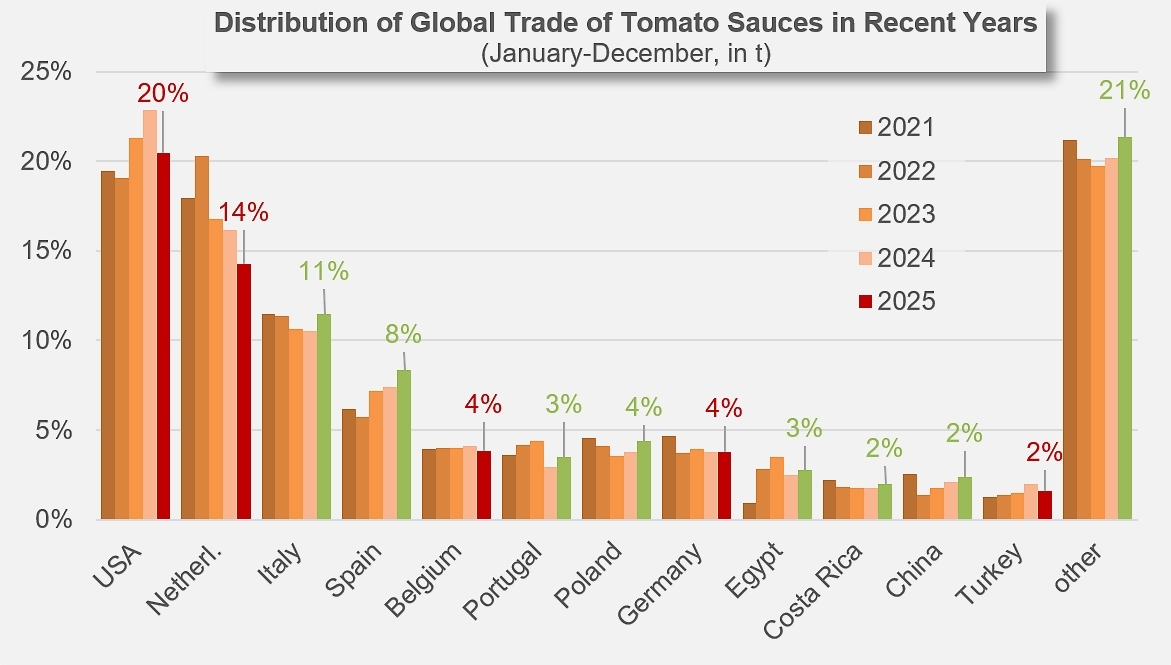
The 2025 global tomato sauce & ketchup (HS codes 210320) market is dominated by a powerful leading trio—the United States, the Netherlands, and Italy—which together account for over 58% of total traded volumes. While the United States reigns supreme over the American bloc and the Netherlands establishes itself as Europe’s essential logistical hub, flow analysis reveals highly distinct zones of influence. Western Europe remains the world’s primary consumption center, supplied almost exclusively by protected European production, while players like Egypt successfully hold their own by dominating trade with East and South Africa due to their geographical proximity.
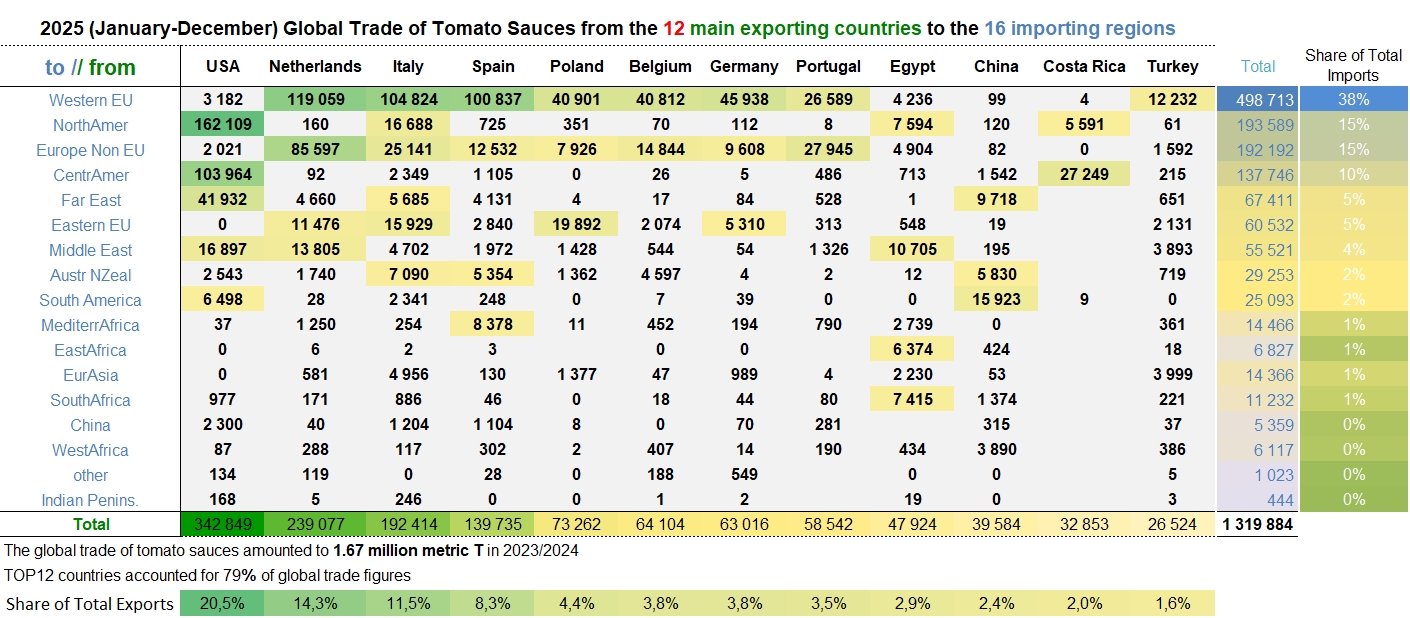
In this competitive landscape, Italy and Spain stand out as two major pillars, though Italy maintains a notable lead with a total volume of 192,400 tonnes compared to Spain’s 139,700 tonnes. In their main competitive arena, Western Europe, the two countries are nearly neck-and-neck, each shipping just over 100,000 tonnes, illustrating saturation and head-to-head competition in this mature market. However, their trajectories diverge as soon as they move beyond EU borders: Italy boasts far greater reach in North America and throughout Eastern Europe, confirming its status as a versatile global exporter. Conversely, Spain favors a more pronounced strategy of geographical and historical proximity, clearly dominating the Mediterranean African market where Italy has very little presence. In summary, while the Italian model relies on global omnipresence and strong penetration of Anglo-Saxon and Slavic markets, Spain consolidates its European position while cultivating strategic niche markets in its immediate neighborhood, thus completing a global panorama where regional powers, such as Costa Rica in Central America, ensure the stability of local supplies.
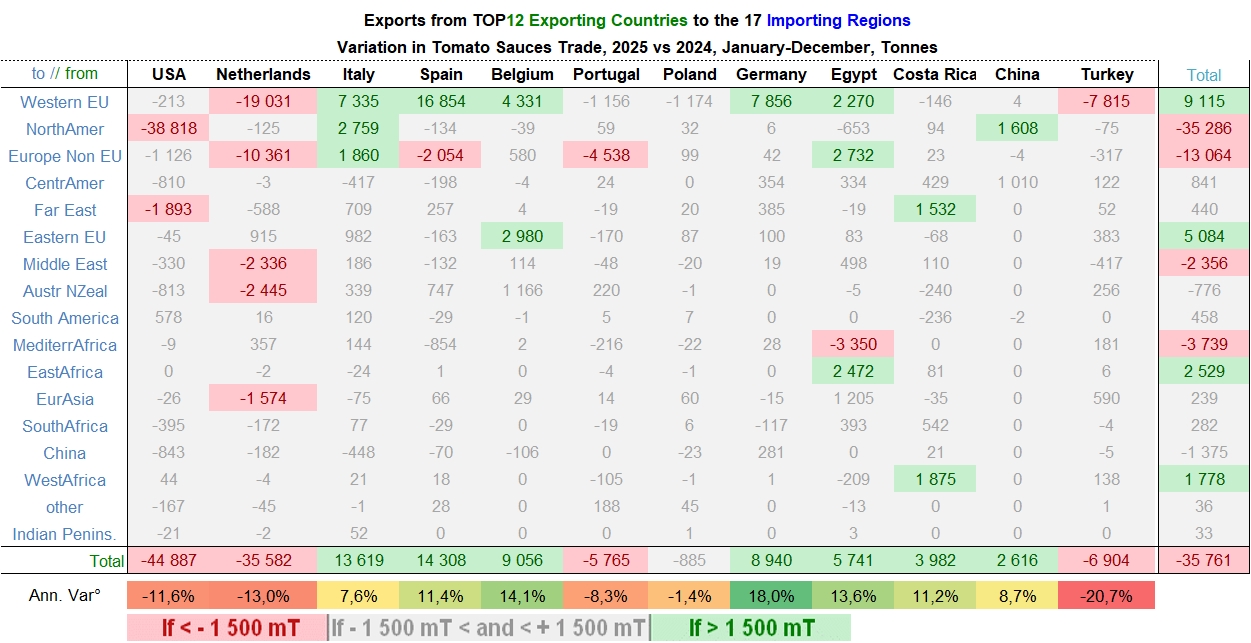
In a context of a slight global downturn, the analysis of performance variations between 2024 and 2025 reveals a contrasted landscape. Although dramatic, these shifts appear to be the result of cyclical readjustments rather than a fundamental challenge to the deep-seated structures of the global sauce and ketchup trade. The annual results show temporarily weakened positions for the two historical leaders, the United States and the Netherlands, with respective declines of 44,800 and 35,500 tonnes. For the Netherlands, this widespread dip across the European continent suggests one-off logistical trade-offs, while for the United States, the downturn is almost entirely concentrated in the North American market, specifically toward Canada. This massive slump of nearly 39,000 tonnes toward the Canadian neighbor could be part of an adjustment in annual flows or mark the first signs of a growing preference for domestic products.
Conversely, Italy and Spain are taking advantage of this market breathing space to consolidate their influence, capturing the bulk of growth in Western Europe with increases exceeding 14,000 tonnes for Italian sauces and 13,000 tonnes for Spanish products. This positive dynamic is also evident among other players, such as Egypt, which is strengthening its African foothold, or Germany, which is asserting itself as an increasingly credible alternative to the Dutch hub. However, these swings remain characteristic of a commodity market sensitive to transport costs and harvest fluctuations. While Turkey and Portugal have taken a step back this year, these variations often appear as micro-adjustments within a globally stable system, where established positions remain solid despite the annual fluctuations in export flows.
The monthly trade results (exports, imports, pastes, canned tomatoes, quantities, prices) are published on the TomatoNews website for each of the most important countries in each category. Consult them regularly and be among the first to know!
Find all the topics published under the tag “Trade, statistics, Consumption” by entering the keyword “trade” in our quick and/or advanced article search module.
Source: TDM
<h1 class='my-heading'>Just some HTML</h1><?php echo 'The year is ' . date('Y'); ?>