News
Slight decline in global tomato paste trade in 2024/2025
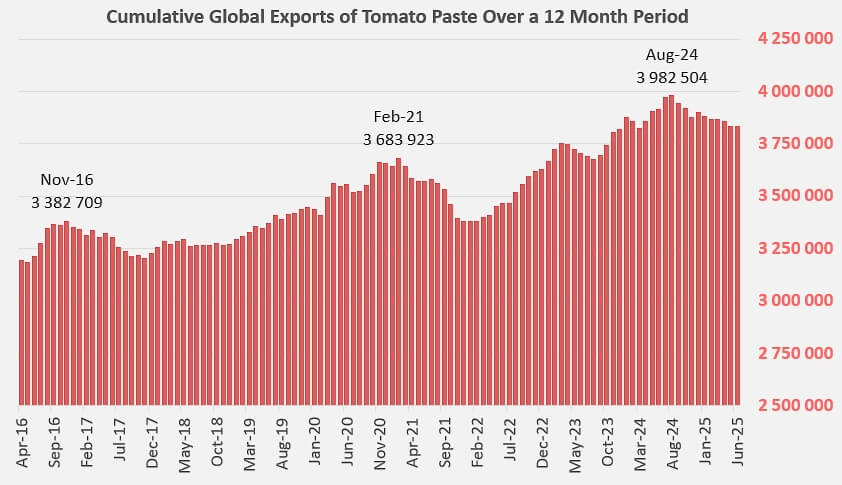
As shown by the monthly monitoring of global tomato paste exports published on our Tomato News website (see additional information at the end of the article), cumulative trade figures over twelve months (rolling model) are gradually tending to decline. Since peaking at 3.98 million tonnes in August of last year (for the period September 2023-August 2024), volumes have gradually declined, reaching a peak of 3.834 million metric tonnes (t), which constituted the overall result for the July 2024/June 2025 financial year.
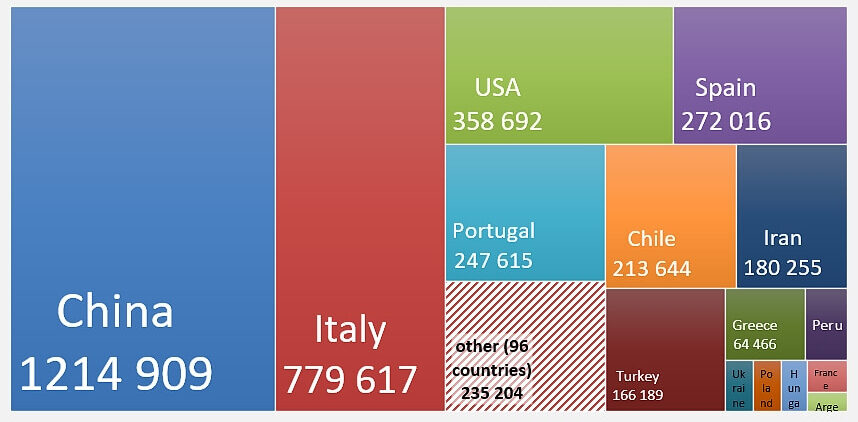
This new financial year has not really brought any significant changes to the global hierarchy of the sector: with 1.2 million tonnes exported and 31% of the global market in 2024/2025, the Chinese sector remains the undisputed leader in global supplies of tomato paste (customs codes 200290), ahead of the Italian industry, whose foreign sales generated nearly 780,000 t of finished products and supplied 20% of the market. In third place last year, US products accounted for nearly 10% of global trade, with just under 359,000 t of concentrates exported.
Smaller gaps separate the other players in the concentrates market: with 272,000 t exported in 2024/2025 (7% of the total), Spain is ahead of Portugal, which exported 247,000 t and held 6.5% of the market, and Chile, which exported nearly 214,000 t of concentrates (5.6% of total global trade).
Iran (180,000 t) and Turkey (166,000 t) are the only other two countries to have exported more than 100,000 t in 2024/2025; Greece (65,000 t) and Peru (33,000 t) complete this group of the top ten concentrate processing-exporting countries in 2024/2025: this TOP 10 represented more than 92% of global concentrate trade last year.
Distribution of tomato paste trade in 2024/2025 by main exporting countries (in tonnes)
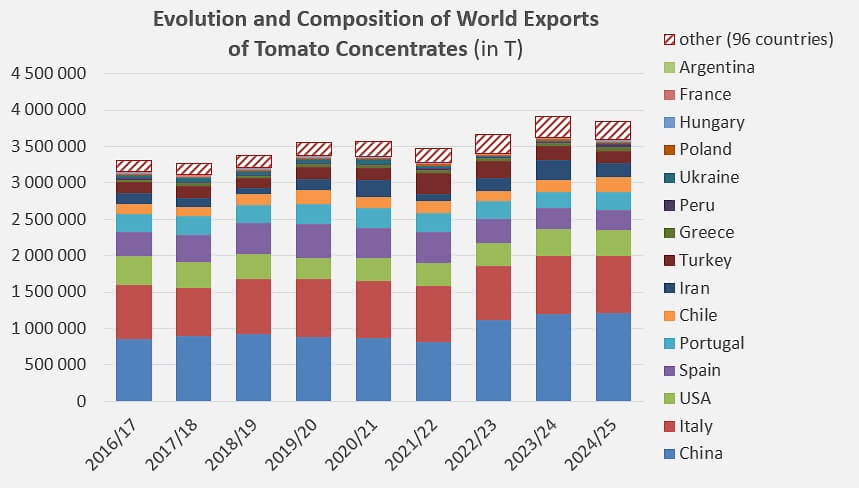
While it remains approximately 4% higher than the average traded quantities over the three previous trading years (from 2021/2022 to 2023/2024), this volume represents a slight decline (-2%) compared to the 3.91 million t recorded at the end of the 2023/2024 financial year: the overall trend remains upward, while making annual adjustments that highlight the fact that global demand is likely growing less rapidly than the quantities processed in recent years. This is evidenced by the latest annual variations in foreign sales from Iran (-106,000 t), the US (-24,000 t), Turkey (-15,000 t), Spain (-13,000 t), Italy (-12,000 t), and a few other countries, which, combined, have more than offset the increases in Chile (58,000 t), Portugal (26,000 t), Greece (23,000 t), China (16,000 t), and Peru (14,000 t), and reduced the activity of the last financial year by more than 78,000 t compared to the results for the 2023/2024 marketing year.
On the other hand, comparing 2024/2025 performance with the average activity levels of the three previous years reveals only two significant declines, in Spain (-74,000 t) and Turkey (-66,000 t); for almost all other countries (China, Chile, Greece, USA, Italy, Peru, Hungary, etc.), the last year was synonymous with growth, in a global market that mobilized more than 150,000 t more than in the 2021/2022-2023/2024 period.
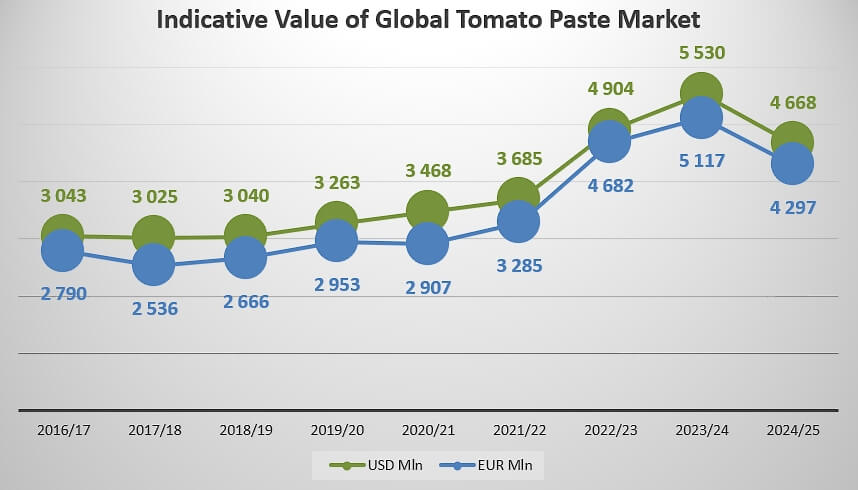
The observed decline in quantities was accompanied by a decline in global prices, with a total value of tomato paste trade estimated at around USD 4.67 billion (EUR 4.3 billion) in 2024/2025, virtually stable compared to the average of the previous three years but a sharp decline (around 16%) compared to the indicative value of global trade in 2023/2024 (USD 5.53 billion).
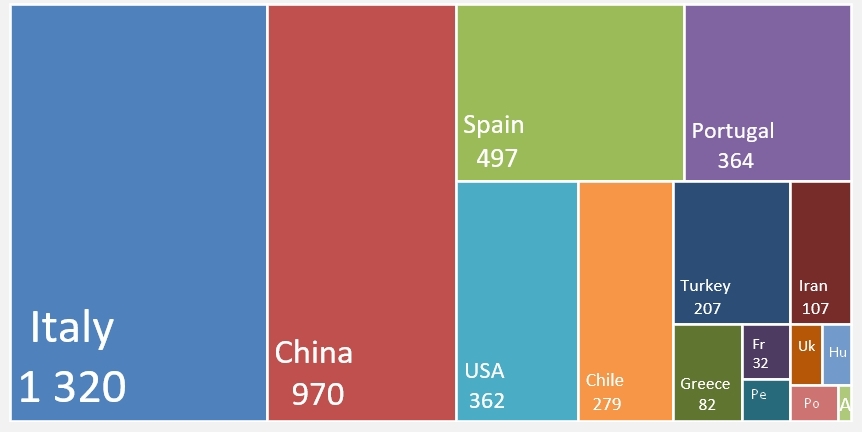
Although the world’s leading exporter of tomato paste by volume in 2024/2025, China ranked only second in terms of turnover, with a result of around USD 970 million, significantly lower than that of Italy, whose exports last year were valued at around USD 1.32 billion; Spain’s profit was just under USD 500 million, well ahead of Portugal and the United States, which achieved almost the same figure at USD 360 million. Chile, Turkey, and Iran generated revenues of USD 279 million, USD 207 million, and USD 107 million, respectively.
Distribution of tomato paste trade in 2024/2025 by main exporting countries (in million USD)
Some complementary data
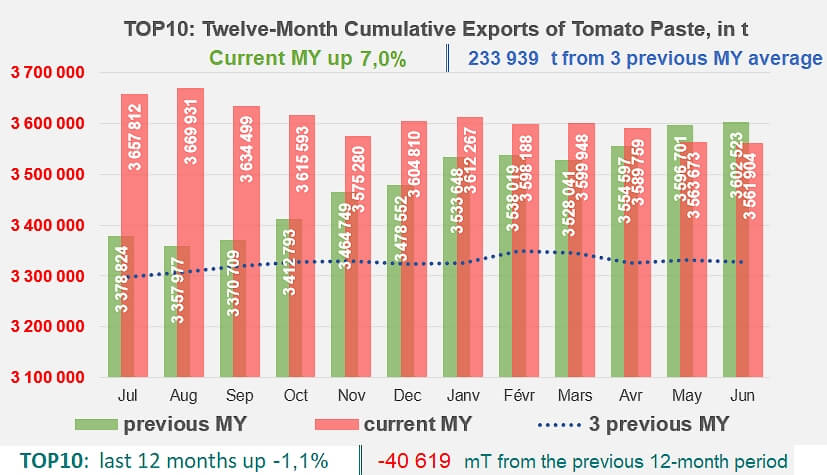
Twelve-month cumulative global trade trends (rolling model).
Comparison of the TOP 10’s twelve-month cumulative global exports (rolling model) for the current year, the equivalent period of the previous year, and the previous three years.
Indicative values of global tomato paste exports over the past ten years.
Source: Trade Data Monitor


