News
Architecture of Trade 2024/2025 – Part 2
Architecture of Trade for Tomato Products, May 2024-April 2025
Moderate increase in volumes, notable contraction in value: these are the characteristics of global tomato products trade in 2024-2025, which consolidate the new “post-Covid” standards.
See also Architecture of Trade 2024/2025 – Part 1
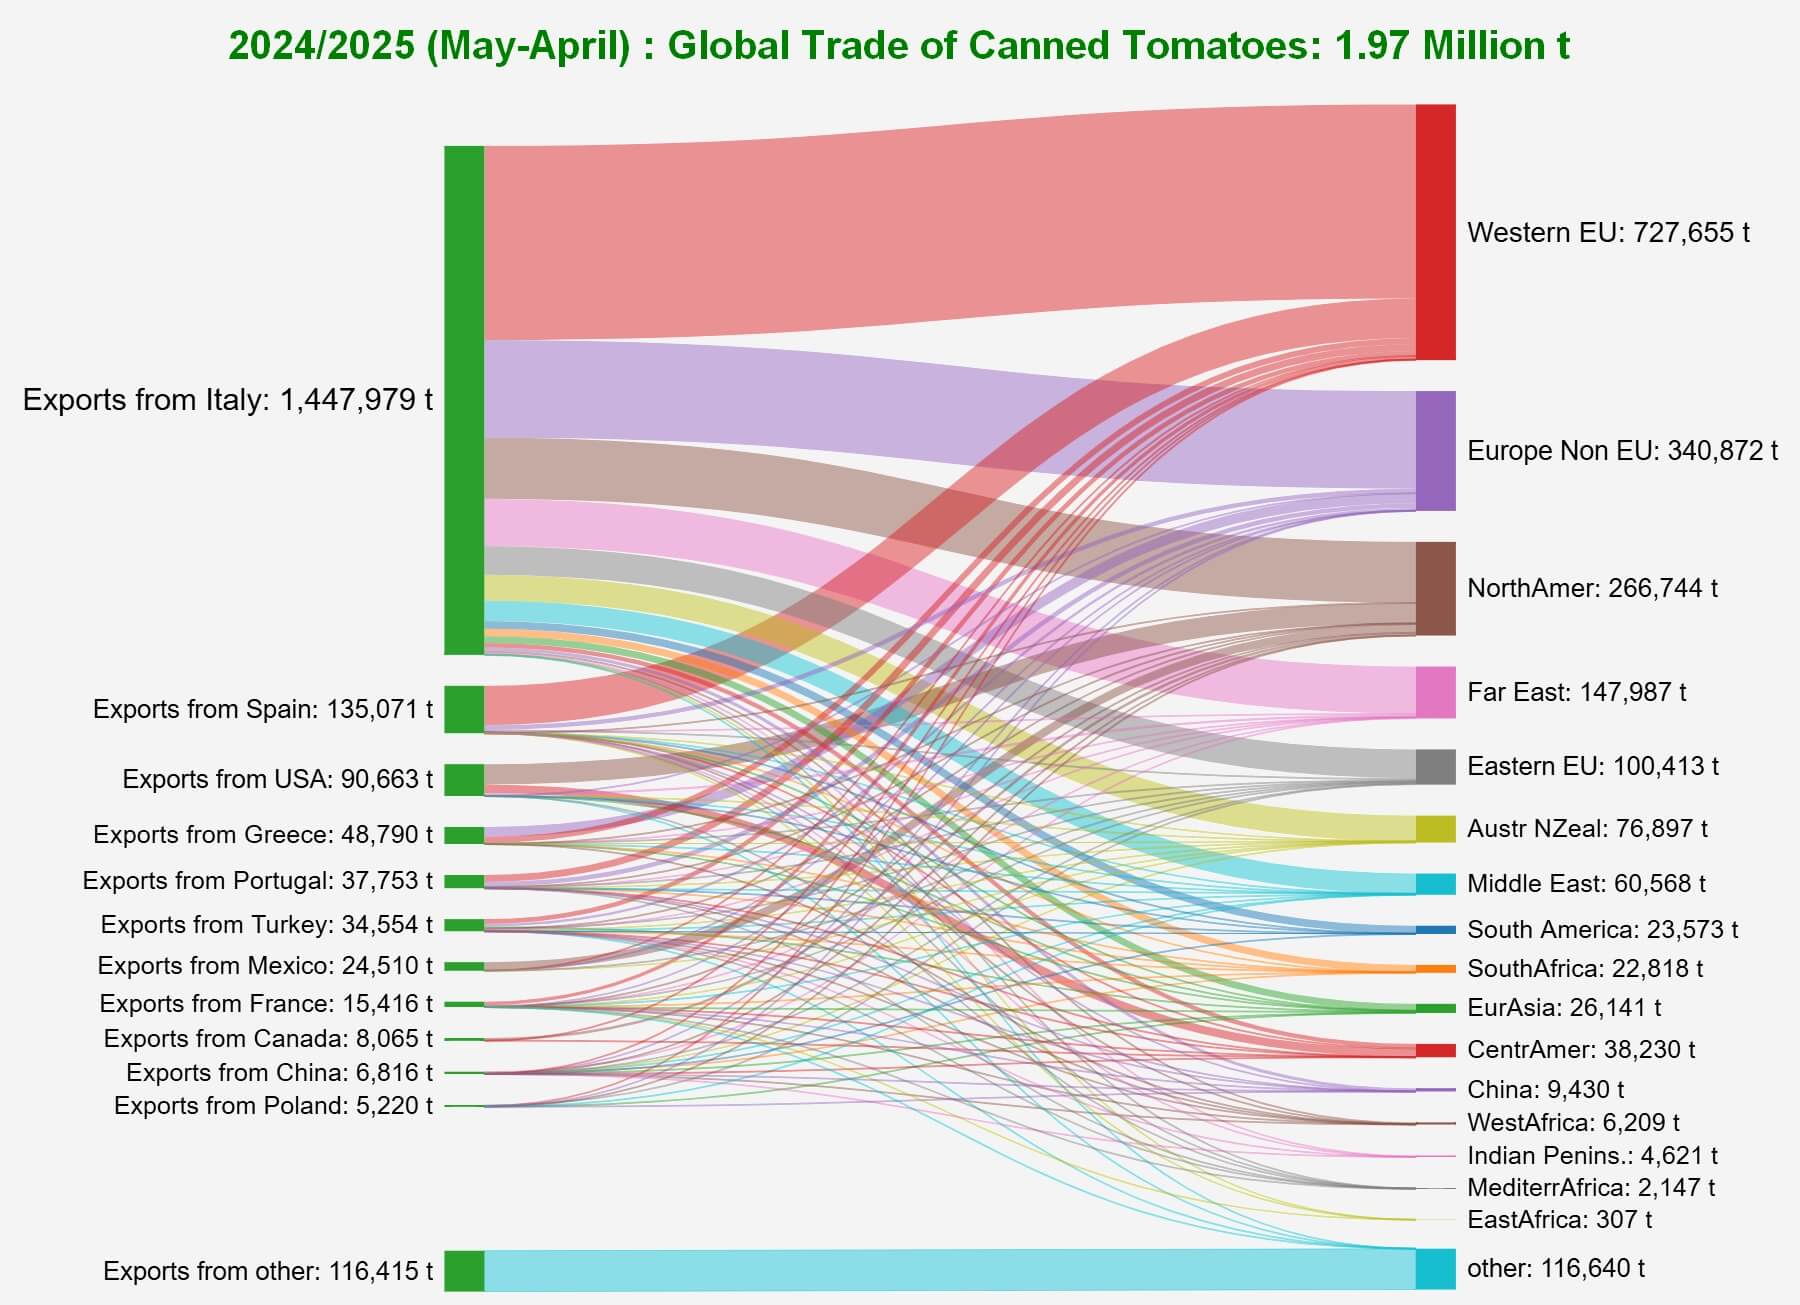
The growth recorded last year in the global canned tomato market (+2.4%) is part of an almost steady upward trend over the last ten years (CAGR: 2.2%), which brought the quantities mobilized in 2024-2025 to a level close to 2 million tonnes. Global supplies in this sector (codes 200210) undoubtedly remain the almost exclusive domain of Italian operators, who supplied almost three-quarters of the products mobilized over the period May 2024 – April 2025. Spain, the second largest operator in the world in this sector, represented around 7% of total global activity last year, ahead of the United States (less than 5%). Consumption is also highly polarized: three regions (Western EU (Germany, France, the Netherlands, Austria, etc.), non-EU Europe (United Kingdom, Switzerland, etc.), and North America (United States, Canada) accounted for 72% of the quantities of canned tomatoes (codes 200210) traded globally in 2024-2025.
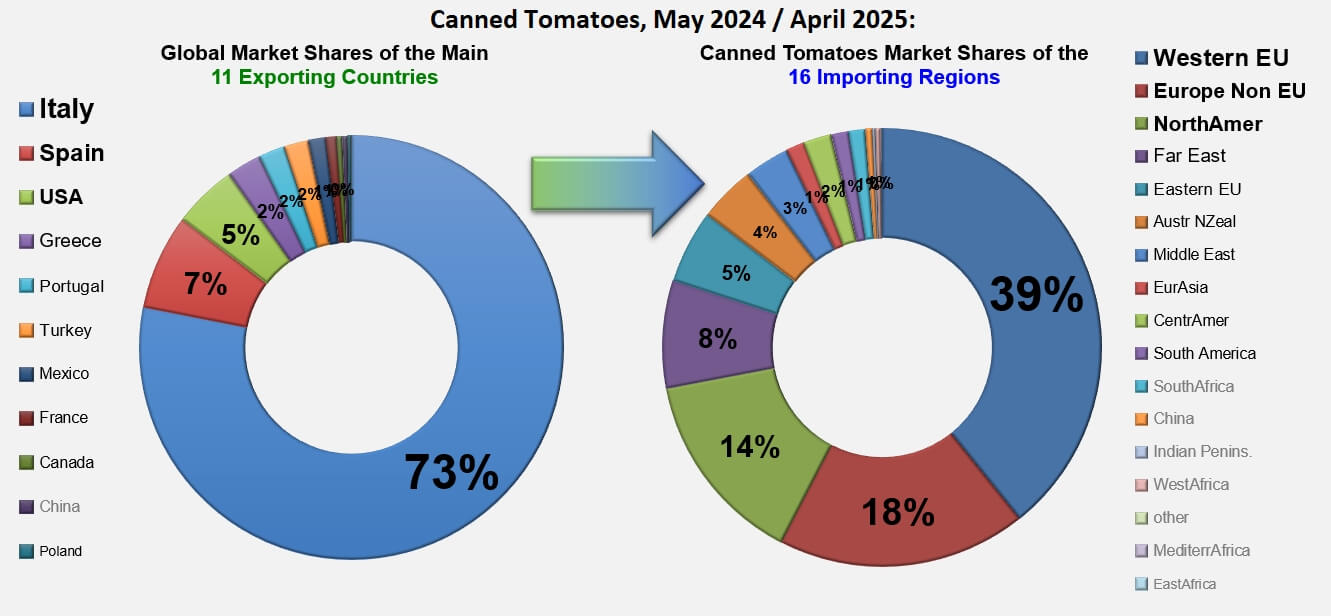
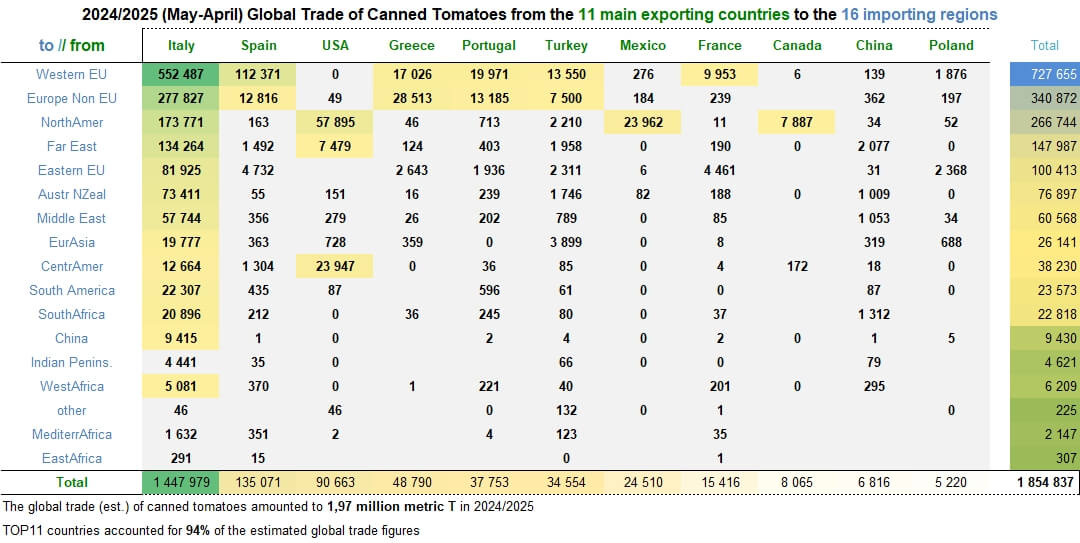
The following table summarizes the results of canned tomato exports from the eleven main processing/exporting countries to each of the sixteen consuming regions; these results represent nearly 94% of global trade for the period May 2024 – April 2025.
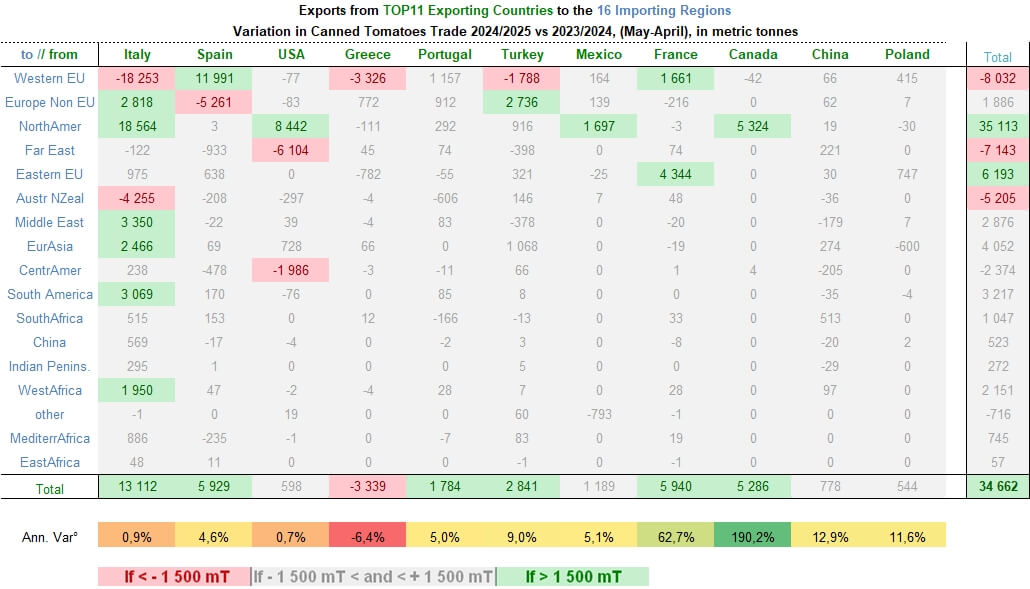
The increase in the quantity of canned tomatoes traded was mainly due to the development of purchases from North American countries (+36,000 t) and, to a lesser extent, from the Eastern EU (Poland, Bulgaria) (+6,000 t). Conversely, the most notable declines concerned exports to Western EU countries (Germany, Sweden, France, etc.), the Far East (South Korea), and Australia-New Zealand.
While the aforementioned declines marginally affected Italy’s performance, the increases recorded in other consumer regions largely offset the declines, and in most cases, export sectors posted significantly improved results compared to the previous period. However, it is worth noting the slowdown in Greek external sales, impacted by the decline in Swedish and German purchases.
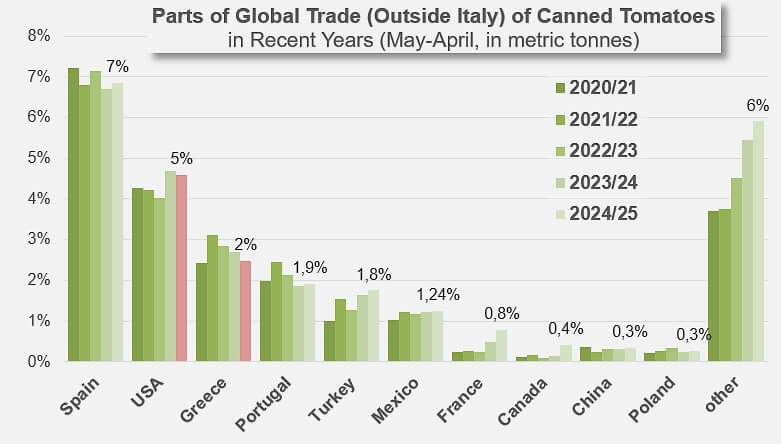
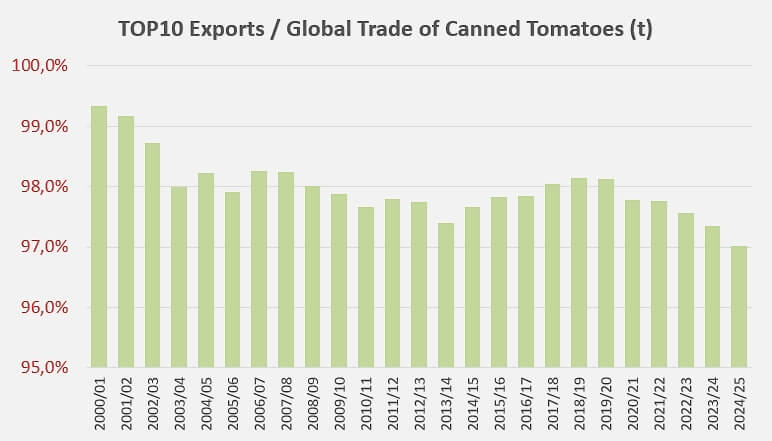
Like the dynamics observed in the export of concentrates, the canned tomato sector is recording, in parallel with an increase in the quantities traded, a development in the export activity of countries outside the group of world leaders (see additional information at the end of the article): over the past decade, the quantities mobilized by “other countries” have increased from around 40,000 tonnes to nearly 120,000 tonnes and their contribution to total world trade has increased significantly, from less than 3% in 2014-2015 to nearly 6% in 2024-2025.
A summary of global trade in canned tomatoes in 2024-2025, between the eleven main processing/exporting countries and the sixteen destination trading regions.
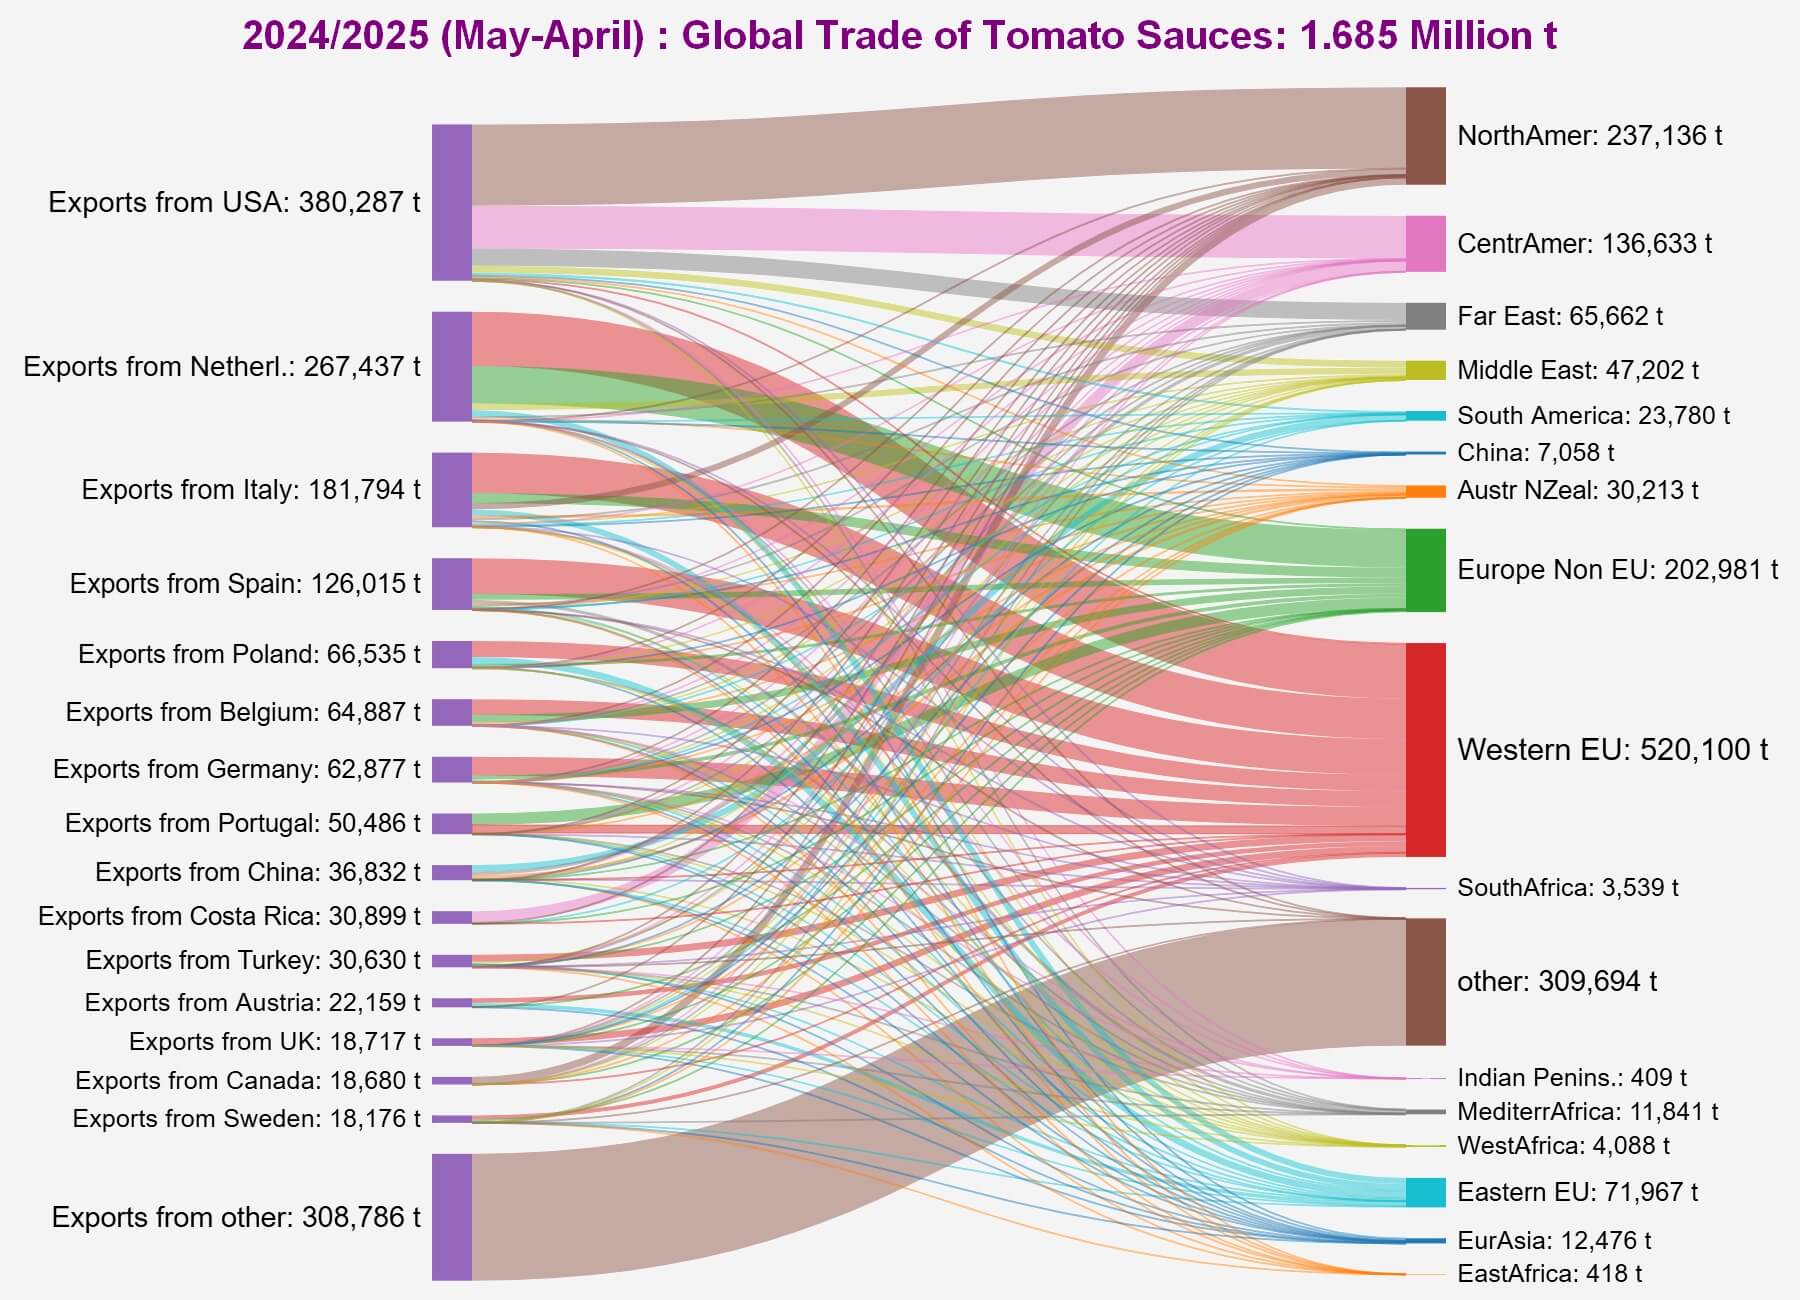
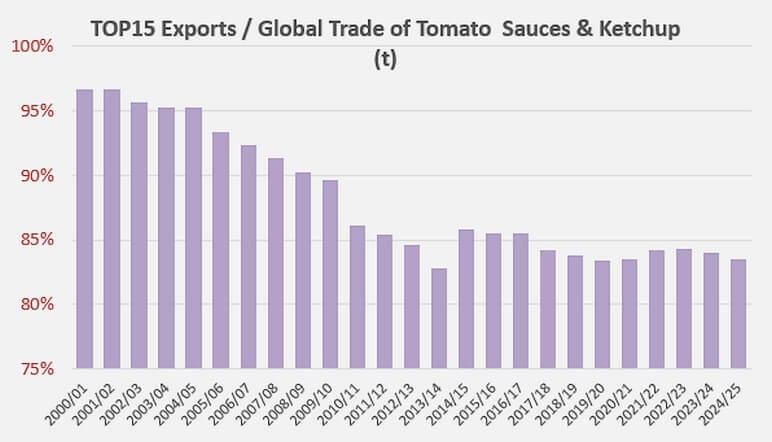
Customs data also show an increase in global trade in tomato sauces and ketchup, which reached 1.68 million tonnes last year, 1% more than in the period May 2023-April 2024 and 3% more than the average of the previous three years. The previous remarks concerning the decline in the “weight” of the leading countries in global activity are also valid here: in this sector, which is much more competitive than those of paste and preserves, the contribution of the TOP15 countries, which reached 97% of global trade in 2000-2001 and still 86% in 2014-2015, only represented around 83% of global activity in 2024-2025.
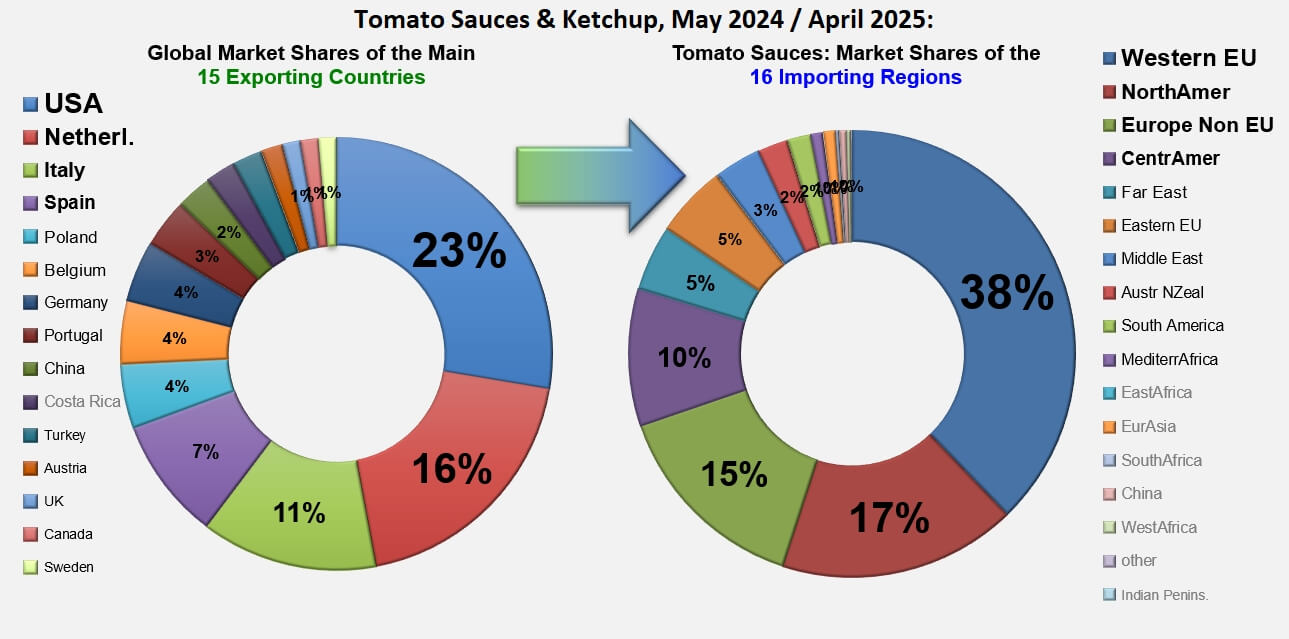
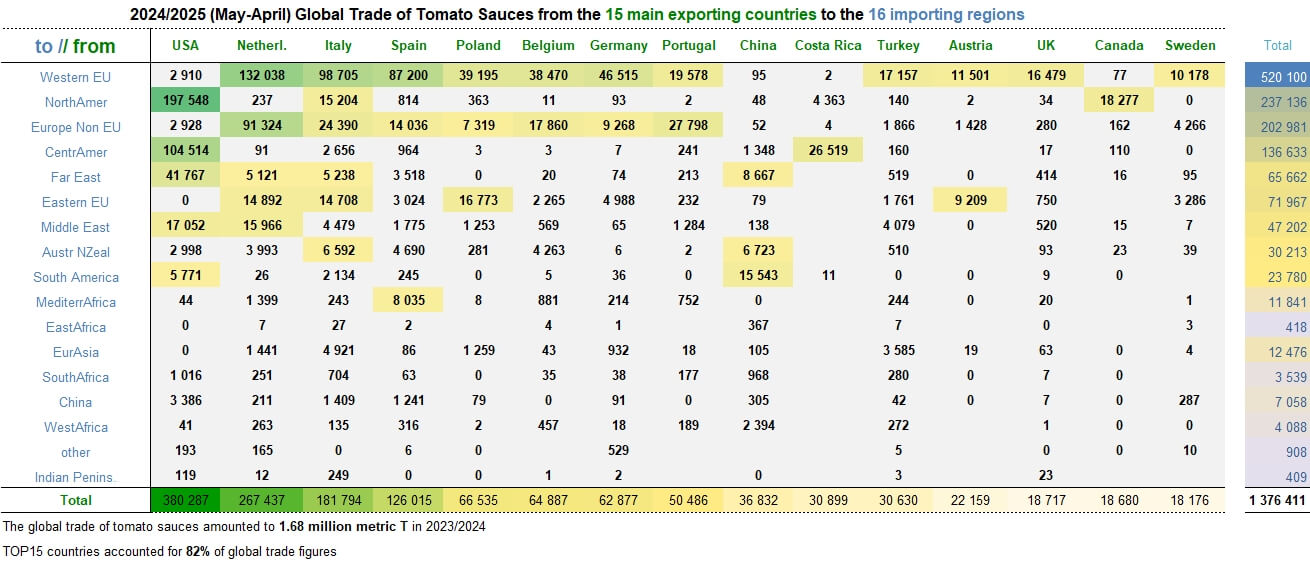
The following table summarizes the results of tomato sauces and ketchup exports (codes 210320) from the fifteen main processing/exporting countries to each of the sixteen consumption regions; demonstrating the dispersion of activity, these results represent just under 82% of global trade for the period May 2024 – April 2025.
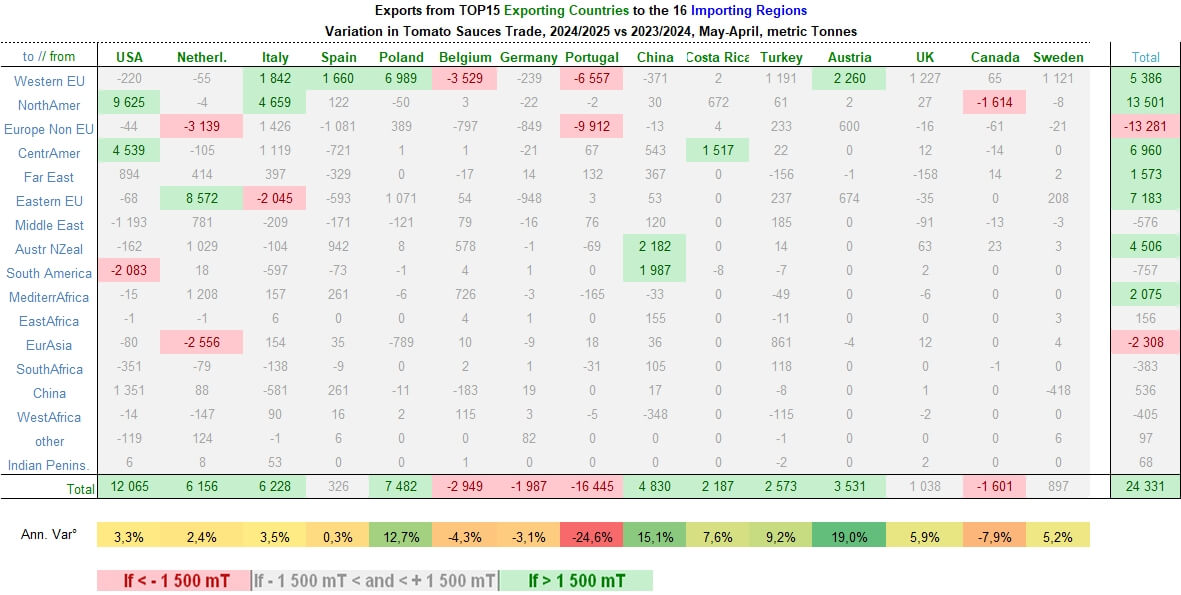
The growth dynamics discussed for tomato pastes and canned tomatoes is also observable in the sauces and ketchup sector: significant annual variations in quantities delivered to destination regions are all upwards, with the exception of those from non-EU Europe and Eurasia; these withdrawals moderately affected Dutch activity but more significantly impacted Portuguese exports, which also suffered from the contraction in German, Dutch, and Spanish purchases. Portuguese foreign sales of sauces and ketchup show the largest decline in the TOP 15 sauces for 2024-2025; less spectacular declines are also noted for Belgian, German, and Canadian activities.
Conversely, driven by increases in exports to North America, the EU (Eastern and Western), Central America, etc., notable increases can be seen in the US, Polish, Italian, and Dutch sectors, to name only the most significant.
Overview of global trade in tomato sauces and ketchup in 2024-2025, from the fifteen main processing/exporting countries to the sixteen destination trading regions.
Some additional information
Contributions of leading exporting countries to the overall activity of each sector.
The customs statistics tables for the different countries and product categories discussed in this article are available on request from the Tomato News Team.
Find all the topics published under the tag “Markets” by using the category “markets” in our news search module on the TomatoNews website at www.tomatonews.com.
The monthly trade results (exports, imports, pastes, canned tomatoes, quantities, prices) are published on the TomatoNews website for each of the most important countries in each category. Consult them regularly and be among the first to know!
Source: Trade Data Monitor
This article was first published in the 2025 Tomato News Yearbook.


