News
Dossier: The Architecture of Global Trade in 2016-2017
This article summarises the global trade of tomato products for the marketing year 2016/2017. For recent information, you can also access the latest articles published in the news section, using the search facility here . You can also contact us if you want specific information on a product or a country.
The slowdown of worldwide trade
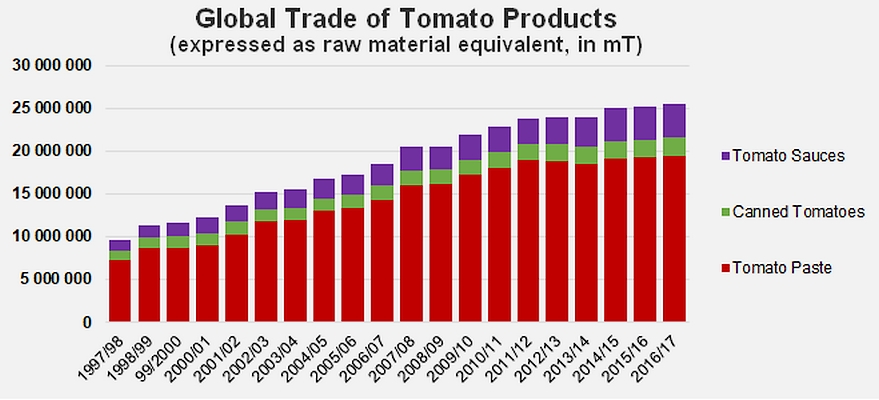
In 1997/98, the 9.68 million tonnes (farm weight equivalent) absorbed by the worldwide trade of tomato products accounted for 42% of the quantities processed that year. Over the most recent marketing year (2016/2017), more than 25.5 million tonnes of products were traded internationally, which amounts to two thirds of the volumes of raw materials processed over the harvest season. At first view, it would seem that an increasing share of the products processed each year are consumed in a different country from the one where the tomatoes are grown, and it seems that worldwide supplies of tomato products increasingly depend on a small number of processing regions.
 Over the past 20 years, the volumes of products exported by processing countries as a whole have been multiplied by 2.5. This intensification of trade, driven by increasing demand and increasing dependency of consumption regions, has not come about in a geographically homogenous way, neither is it uniform in terms of product categories, nor regular over time. The 2011/2012 marketing year represented an inflection points in the dynamics of international trade development: it is estimated that accumulated volumes of paste, canned tomatoes and sauces (in farm weight equivalent) exchanged annually until this period were growing at an average annual rate of close on 6.6%, leading to a gain of just under 1.5 million tonnes between 2010/2011 and 2011/2012. Over the past five years (since the 2011/2012 marketing year), the volumes traded have only progressed at an average annual rate of close to 1.4%, which amounted during the last marketing year to a gain of less than 350 000 tonnes.
 Whilst remaining positive, growth has significantly slowed, leading to a new worldwide commercial context that features sluggish progress and where competition is increasingly aggravated between operators who can no longer count on the regular expansion of demand and are unlikely to be able to acquire significant new market shares other than by claiming those that are already held by competitors.
 Over the past 20 years, the volumes of products exported by processing countries as a whole have been multiplied by 2.5. This intensification of trade, driven by increasing demand and increasing dependency of consumption regions, has not come about in a geographically homogenous way, neither is it uniform in terms of product categories, nor regular over time. The 2011/2012 marketing year represented an inflection points in the dynamics of international trade development: it is estimated that accumulated volumes of paste, canned tomatoes and sauces (in farm weight equivalent) exchanged annually until this period were growing at an average annual rate of close on 6.6%, leading to a gain of just under 1.5 million tonnes between 2010/2011 and 2011/2012. Over the past five years (since the 2011/2012 marketing year), the volumes traded have only progressed at an average annual rate of close to 1.4%, which amounted during the last marketing year to a gain of less than 350 000 tonnes.
  Whilst remaining positive, growth has significantly slowed, leading to a new worldwide commercial context that features sluggish progress and where competition is increasingly aggravated between operators who can no longer count on the regular expansion of demand and are unlikely to be able to acquire significant new market shares other than by claiming those that are already held by competitors.
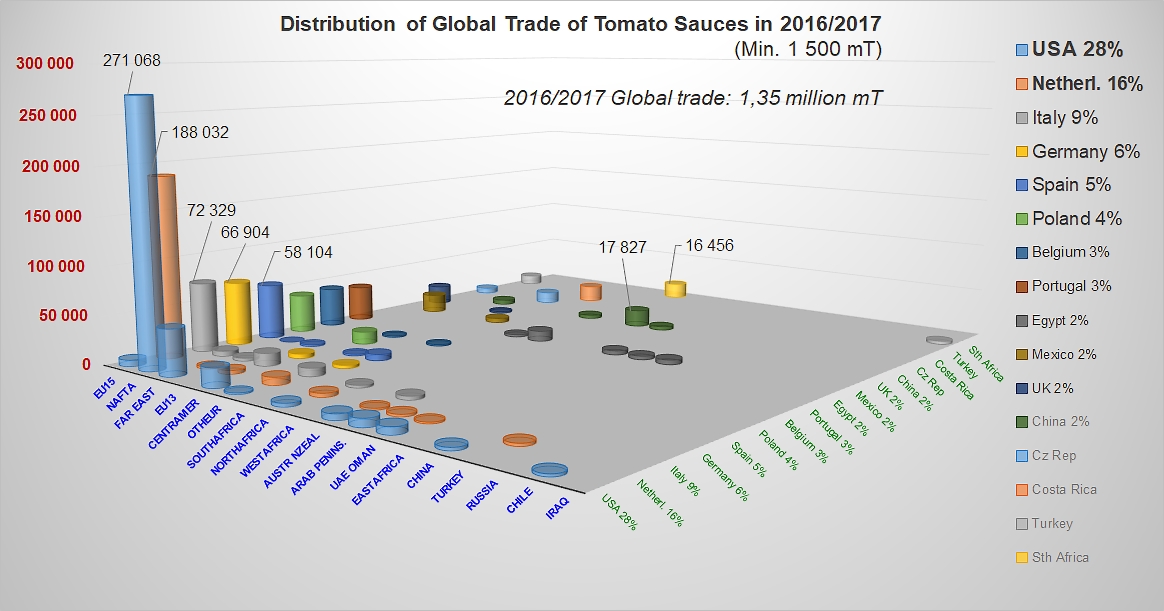
Among the three main product categories, exports of sauces seem to have done better than other categories at resisting the slowdown in dynamics. The development of global exports for this kind of product has been practically linear over the past 20 years, at an average annual rate of close on 5.9%. In 2016/2017, worldwide exports of sauces shifted 1.35 million tonnes of finished products, or the processed equivalent of close on 3.9 million tonnes of raw tomato.
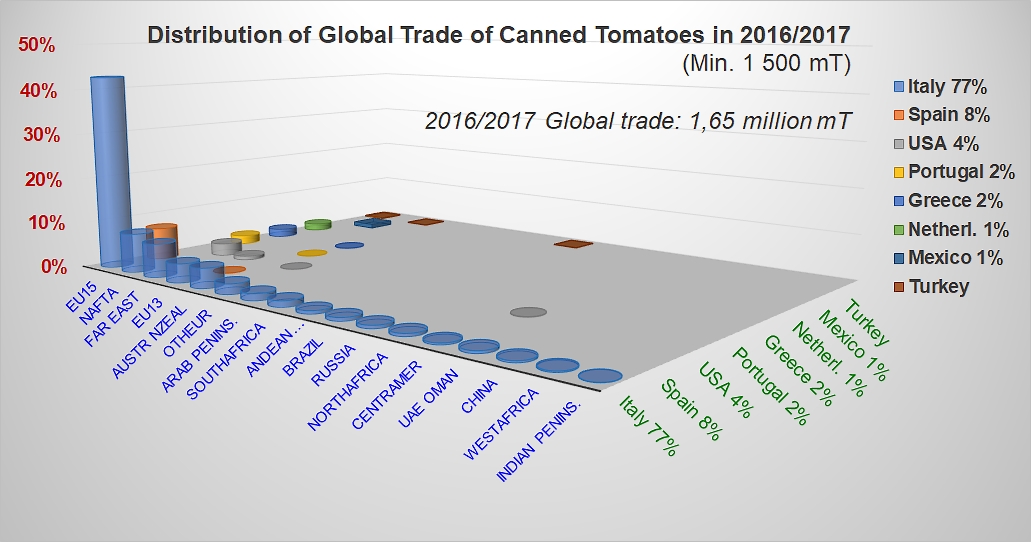
Canned tomato exports not only progressed at a slower rate but also shifted far smaller quantities than the other two categories. Over the most recent marketing year (2016/2017), the global trade in canned tomatoes shifted 1.64 million tonnes of finished products, or approximately 2.1 million mT of raw tomato. Furthermore, growth dynamics in the trade of canned tomatoes have noticeably slowed over the past five marketing years, dropping from an annual 3.5% approximately for the period running 1997/1998-2011/2012, to only 1.8% today.
The paste category is the one that has suffered most from the crisis affecting the international trade in tomato products over the past five or six years. Over the very difficult seasons that followed the excessive production of 2009, the fast pace of growth in trade that the industry had known previously progressively gave way to slower and slower annual progression. Between 2011/2012 and 2016/2017, the volumes of paste exported around the world only increased by 150 000 mT of finished products, whereas they had grown by more than 718 million tonnes over the five years preceding 2011/2012. In the end, average annual growth for the past five marketing years has barely cleared 0.5%. Last year, the volumes of paste shipped between countries around the world amounted to 3.205 million mT of finished products.
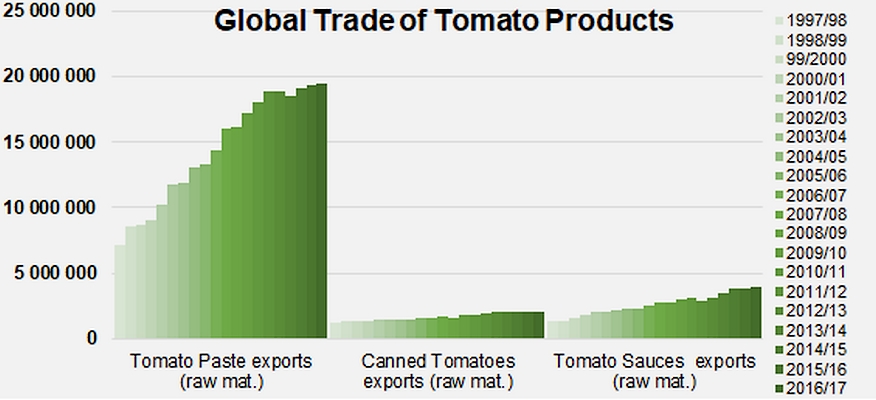
Accumulated growth of worldwide exports for the three main sectors of tomato products (paste, canned, sauces).
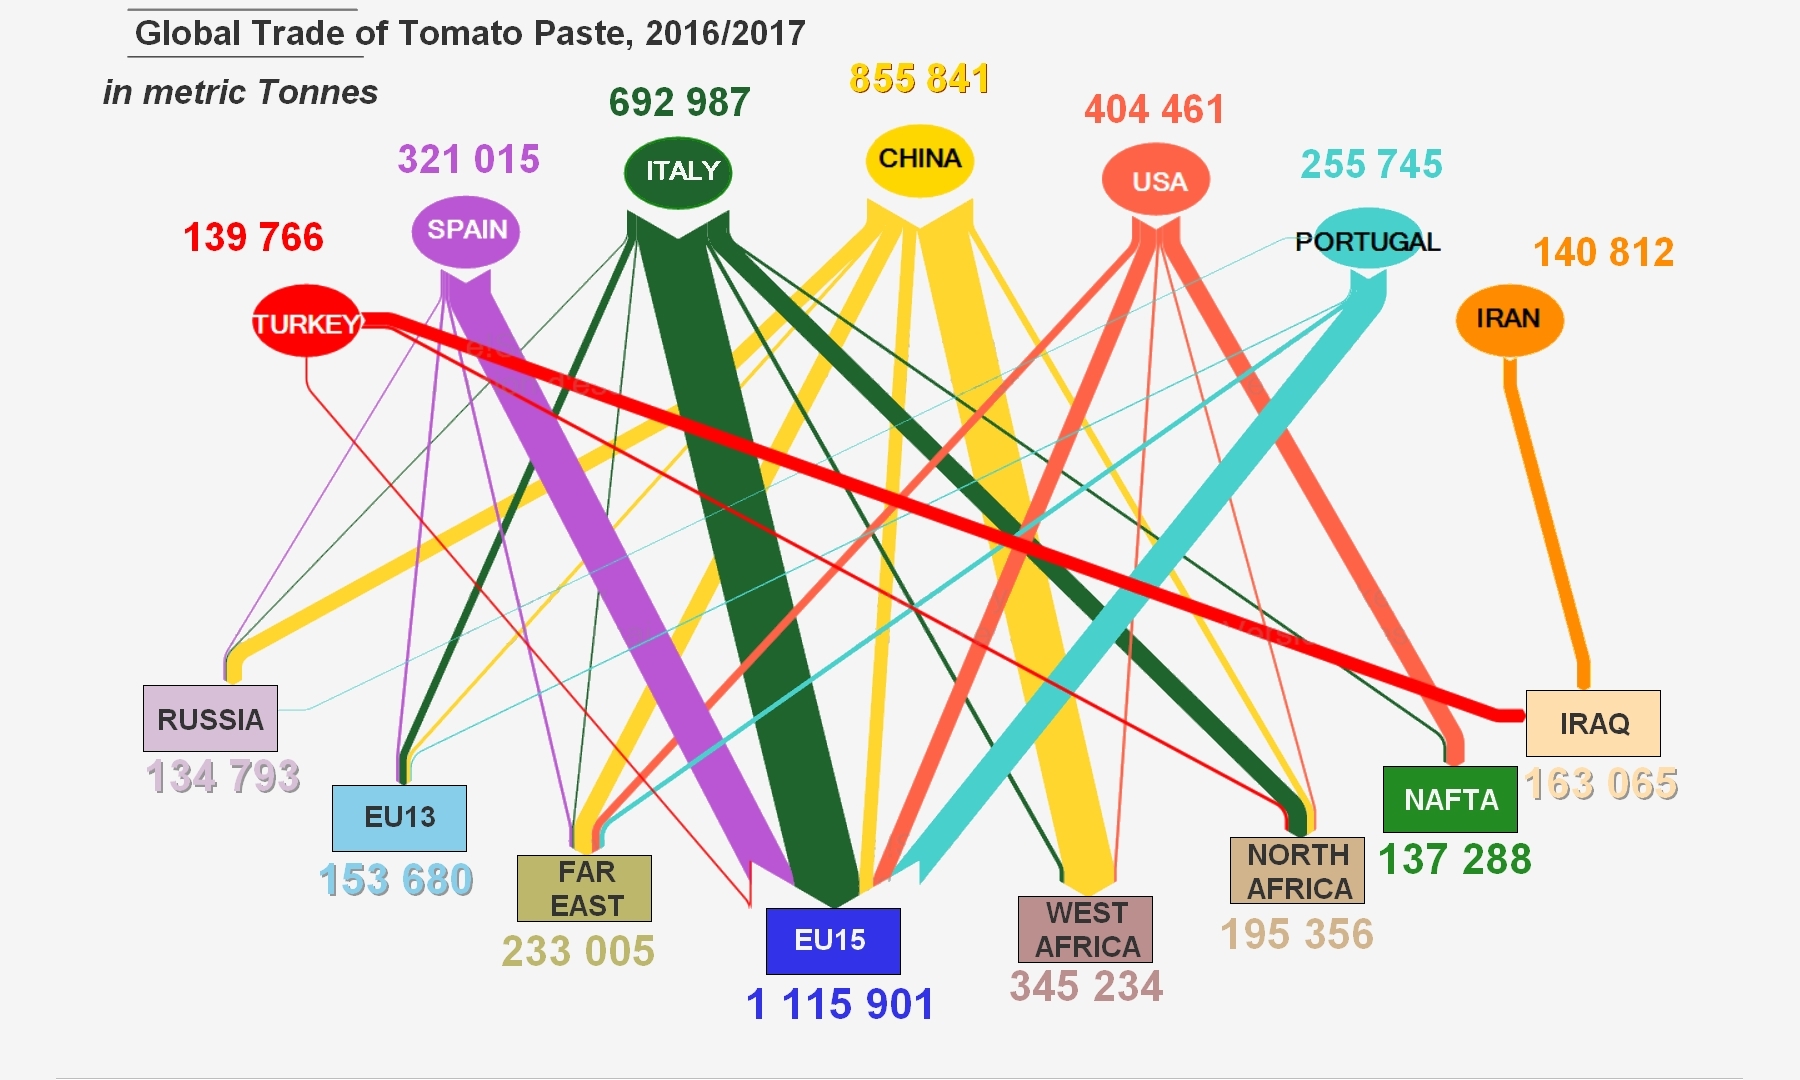
The tomato paste trade in 2016/2017
15 countries shared 97% of worldwide supplies in 2016/2017 (3.2 million mT) of tomato paste, with a 1 to 60 ratio between the 1st global paste exporter (China) and the 15th (Peru). Two countries, China and Italy, "control" half of the world's supplies in this category, a portion that increases to close on 80% of the worldwide total if US, Spanish and Portuguese activities are taken into account. Over the past marketing year, Iran, Turkey, Chile, Ukraine and Greece (between 1 and 4% each) accounted for 15% of the world's paste trade. The five last positions in the Top15 (Netherlands, Germany, Poland, France and Peru) generated 2.5% of the category's exchanges.
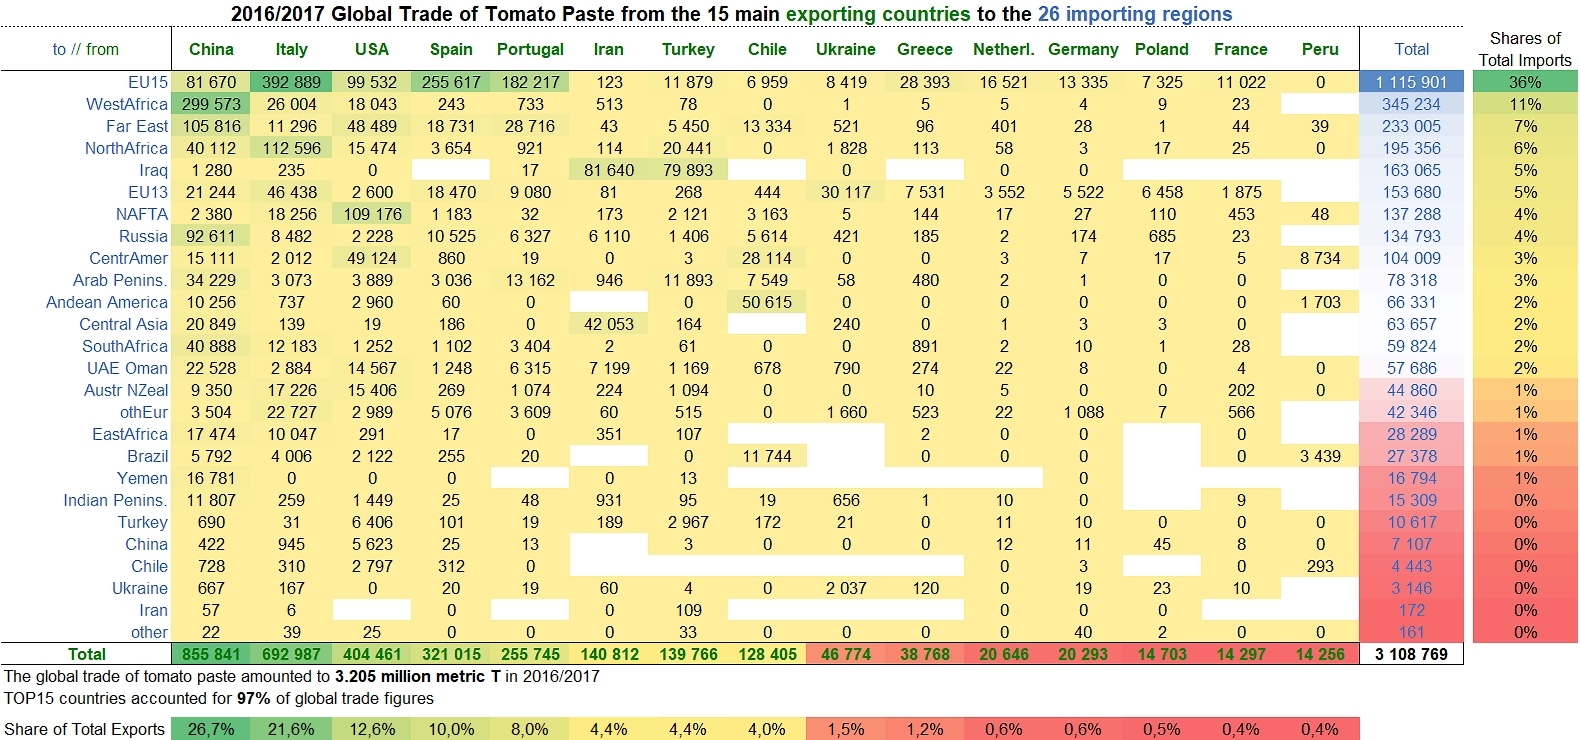
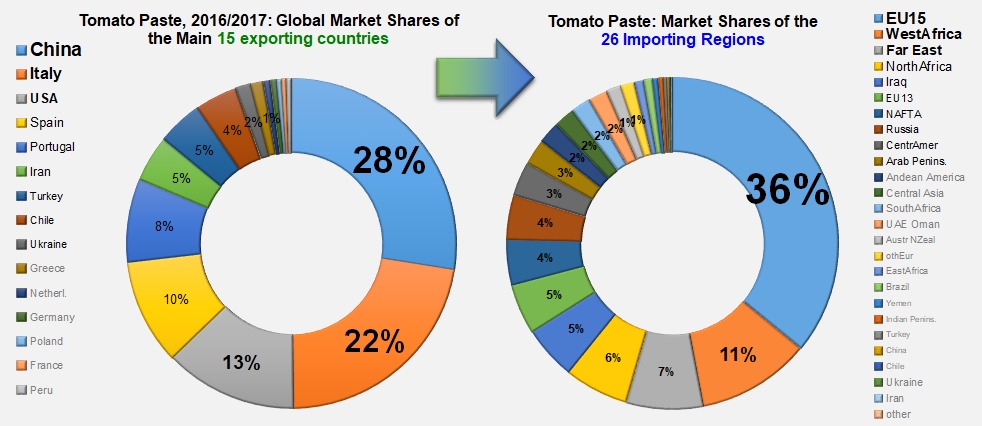
Contributions of the 15 biggest paste supplier countries to the total supplies of the 26 main destination regions.
For these 15 supplier countries, the volumes exported were practically identical in 2016/2017 (+0.3%) to what they had been the previous year (2015/2016). This lack of growth at the worldwide level is the result of a slowdown in trade in a number of importing regions (West Africa, Turkey, Emirates, Southern Africa, EU13, etc.) that has been barely compensated by a limited number of significant increases: North Africa, Andean America, Far East.

Two processing regions have been particularly affected by the slowdown. China's sales to West Africa, the UE15, Southern Africa, the Emirates and the EU13 have decreased sharply. Greece has been mainly affected by a shift in European purchases towards competing providers (the USA, Spain, Portugal), a shift that has also affected Italian exports in this category. Overall, the marketing year has been fairly positive in terms of quantities exported by European countries (Italy +5%, Spain +10%, Portugal +6%, Ukraine +34%, Poland +70%) and countries of South America (Chile +17%, Peru +56%).

Results for the past five marketing years indicate that China has lost part of its influence on the worldwide paste markets (from more than 33% of global trade in this category in 2012/2013 to less than 27% last year), while its main competitor – Italy – struggles to maintain its share at approximately 22% of the global market. US products have suffered from the shift in currency exchange rate that has been more favorable to the euro than to the US dollar. Two challengers have taken a strong stand on the global market over this period of time, with a sharp progression in the case of Spanish sales (from less than 7% of total worldwide exports in 2012/2013 to more than 10% in 2016/2017) and a relatively marked progression in the case of Portuguese products (from less than 7% to more than 8% of the worldwide total). Over this period, secondary operators on the global market all saw their market shares increase.

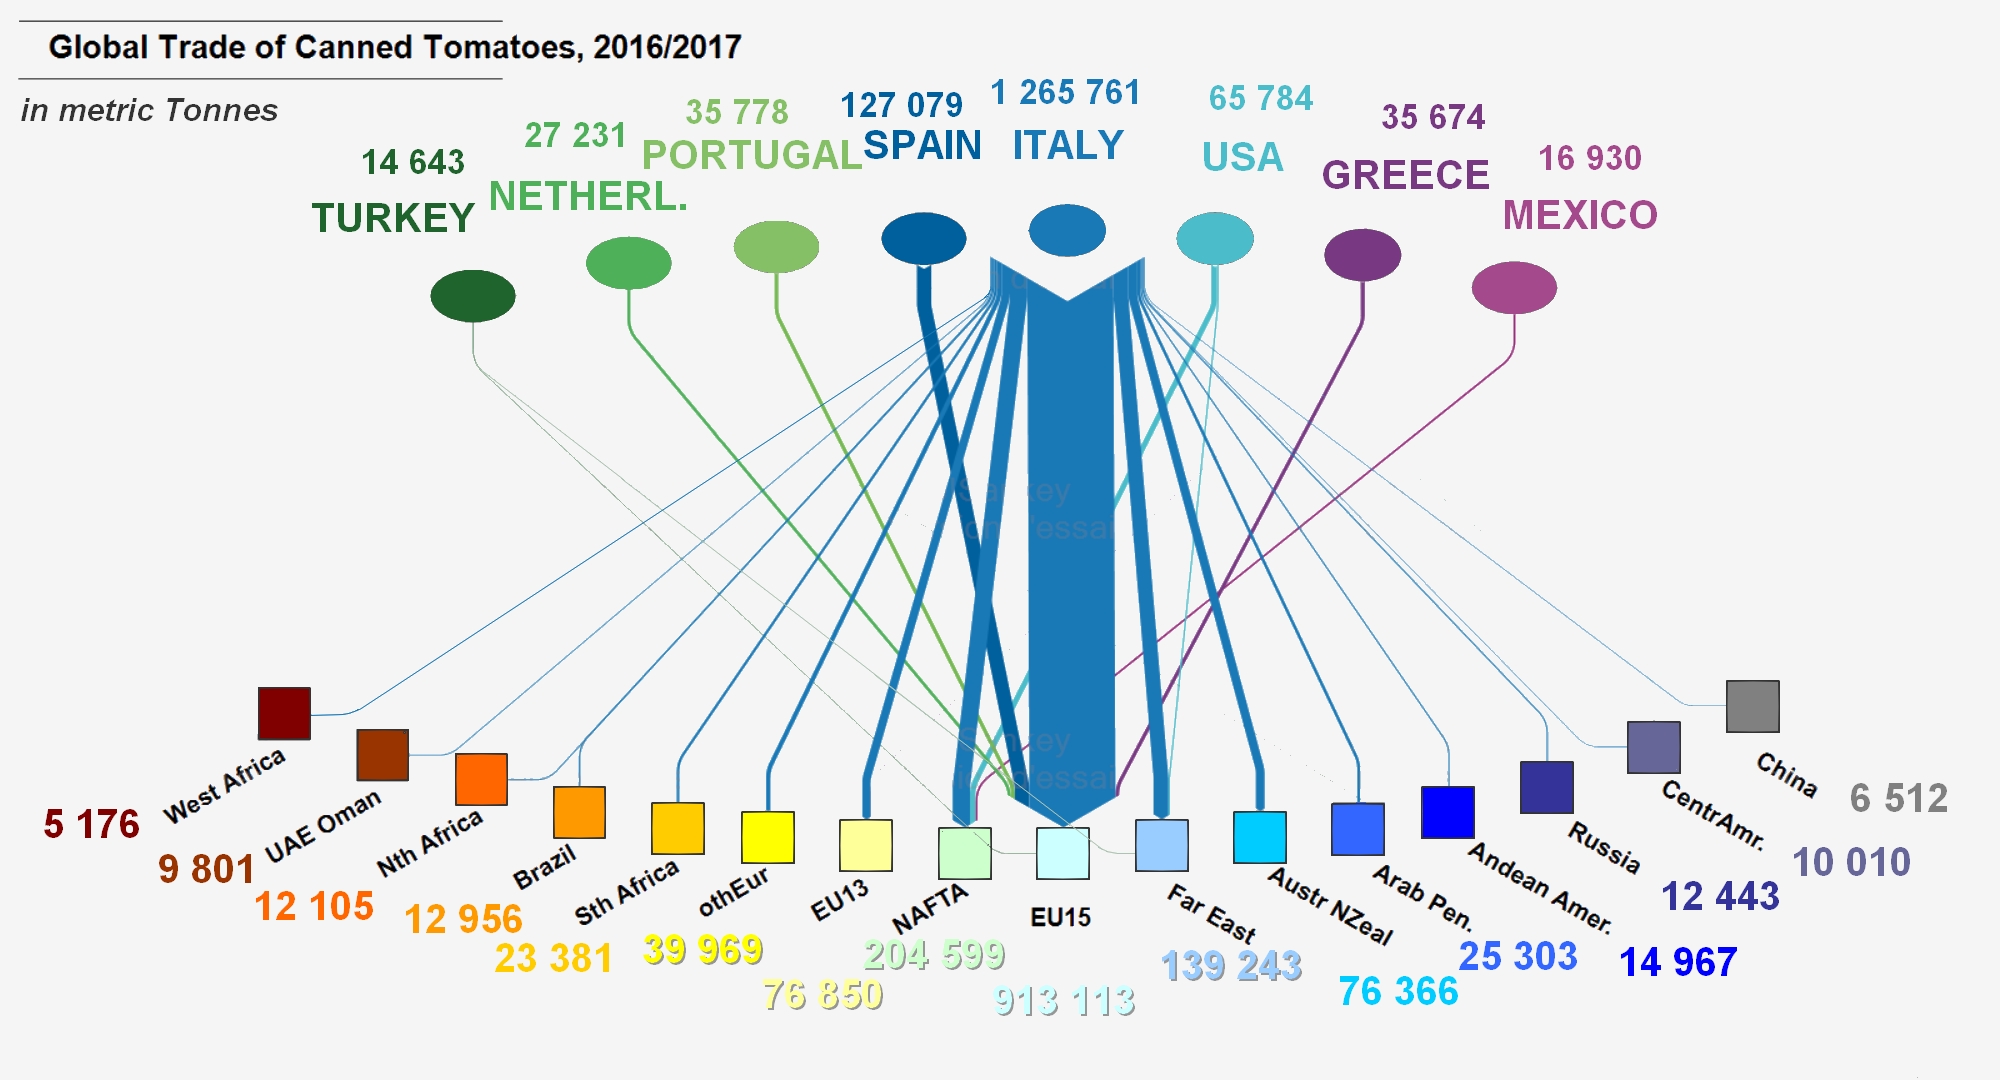
The canned tomato trade in 2016/2017
Worldwide supplies of canned tomatoes are mostly provided by Italy. With more than 77% of the quantities used in this category last year, the Italian industry has stayed well ahead of its main rival, Spain (7.8%) and the world's 3rd ranking exporter, the United States (4%). Outlets are just about as polarized: in 2016/2017, the EU28 imported more than 62% of the volumes traded, with the North American and Far Eastern markets respectively absorbing 13% and 9% of the shipments traded around the world. Other operators, in Portugal and Greece, are trying to get their share of the trade flow, but remain relatively discrete (2.2% of global trade for each of these countries), while three other countries of the world's Top8 canned tomato exporters (Netherlands, Mexico and Turkey) account for just above 3.5% of global trade altogether.
Worldwide supplies of canned tomatoes are mostly provided by Italy. With more than 77% of the quantities used in this category last year, the Italian industry has stayed well ahead of its main rival, Spain (7.8%) and the world's 3rd ranking exporter, the United States (4%). Outlets are just about as polarized: in 2016/2017, the EU28 imported more than 62% of the volumes traded, with the North American and Far Eastern markets respectively absorbing 13% and 9% of the shipments traded around the world. Other operators, in Portugal and Greece, are trying to get their share of the trade flow, but remain relatively discrete (2.2% of global trade for each of these countries), while three other countries of the world's Top8 canned tomato exporters (Netherlands, Mexico and Turkey) account for just above 3.5% of global trade altogether.

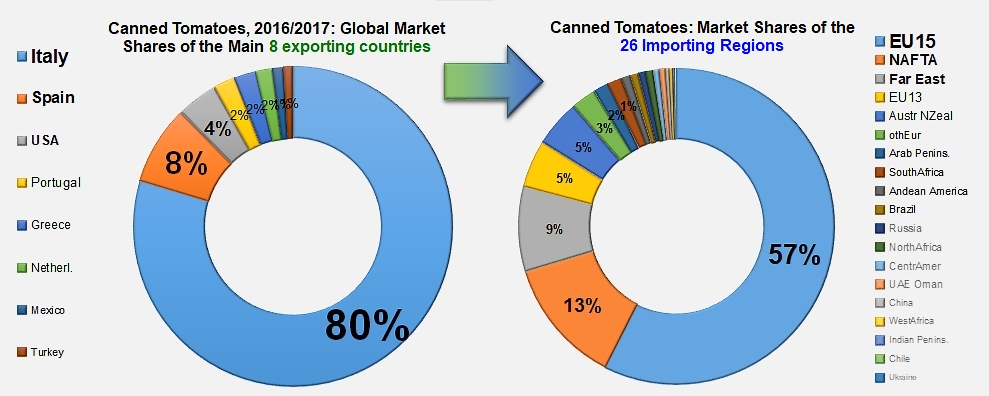
Polarization of suppliers and outlets for the canned tomato category
Over the past marketing year, the quantities of canned tomatoes traded at a worldwide level only progressed by 1% (16 700 mT) compared to the previous year. In the context of the very particular supply pattern for worldwide trade in this category, the variations have a considerable impact on a restricted number of destinations: in 2016/2017, the EU28 was the only one of the 26 regions considered whose total purchases significantly dropped against the previous marketing year (-10 400 mT). This contraction directly impacted the two leading countries for this market – Italy and Spain – and in a way that is all the more noticeable for the fact that this drop coincided with a slight shift of purchases towards other competing sources (Portugal and the Netherlands). In the final count, Spain and Greece (to a lesser extent) have paid the price for the market downturn in Europe, while Italy has improved its performance thanks to an exceptional increase in Argentinian purchases of canned tomatoes (see our article on the difficulties of competition in Argentina published in the March 2018 issue) and an increase in US imports. As for US operators, they benefited from a notable increase in Canadian purchases.

Over the past five marketing years, Italy has generally consolidated his position as market leader, while Spain has had to give up some market shares.

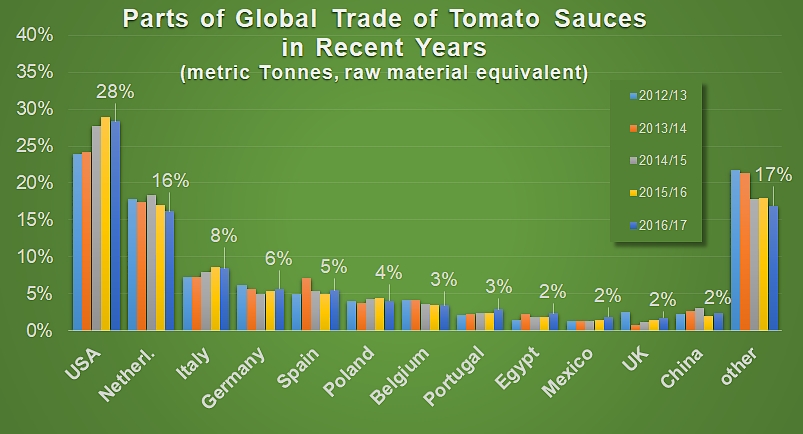
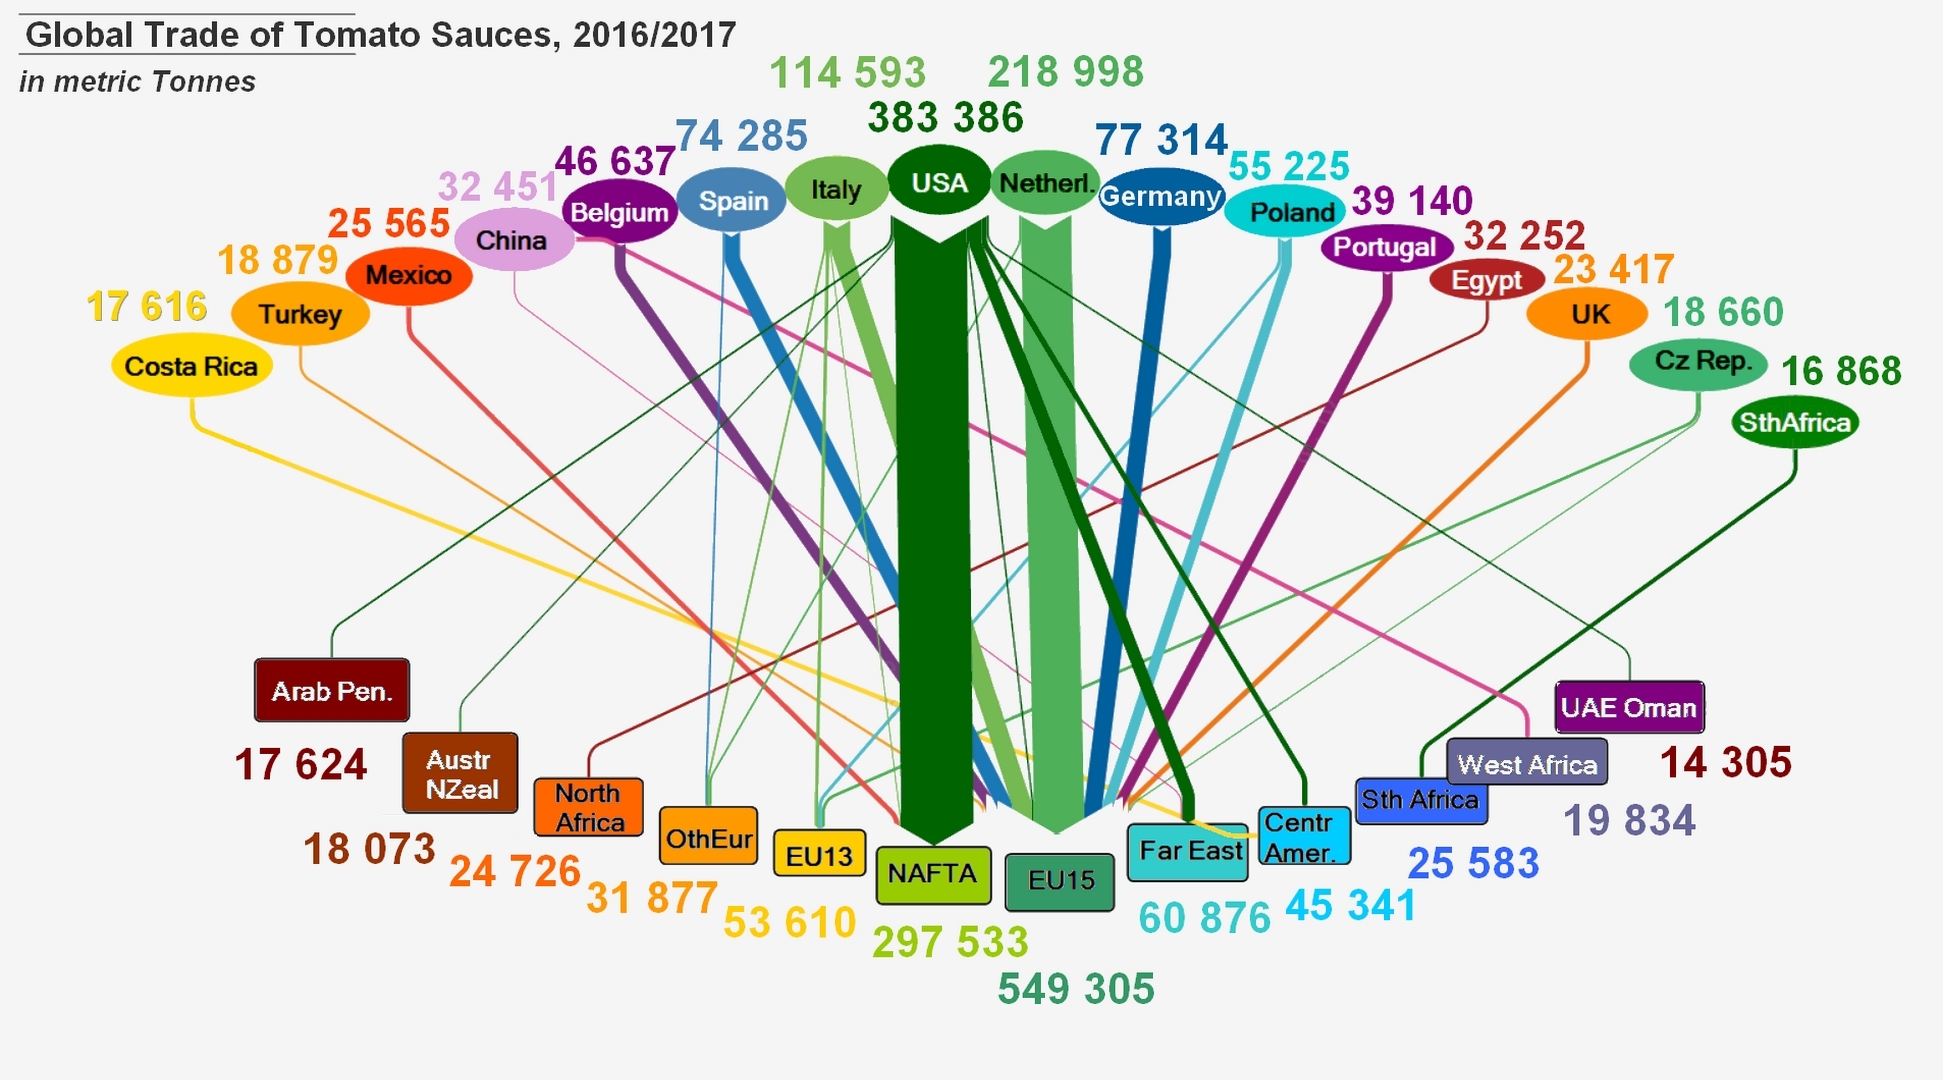
The sauces and ketchup trade in 2016/2017
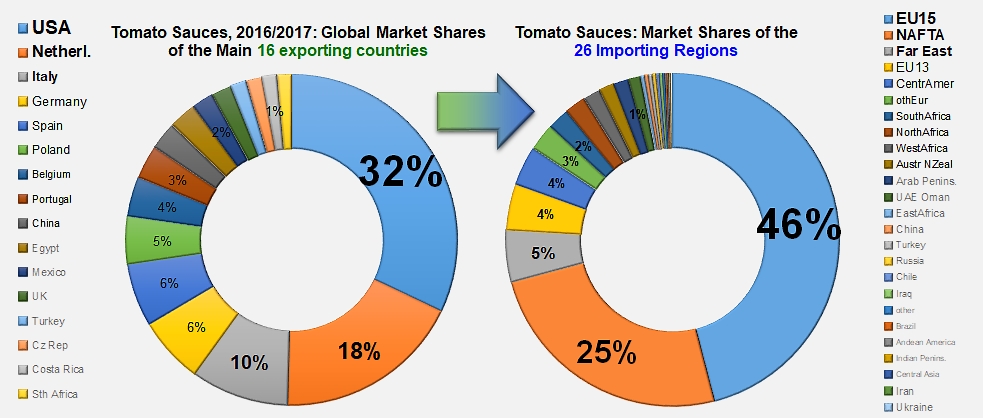
In this category of worldwide trade, it is mainly the outlet markets that are polarized, including the three biggest ones: the EU28, NAFTA and the Far East. These destinations absorbed 2% of the volumes traded last year (1.35 million mT of finished products). Unlike the canned tomato category or even, to a lesser extent, the paste category, the worldwide market for tomato sauces and ketchup involves a relatively high number of exporting countries, including several who only operate as second-stage processors, with a size ratio close to 23 between the biggest of them (the USA) and the last of the Top16 (South Africa) over the 2016/2017 marketing year.
In this category of worldwide trade, it is mainly the outlet markets that are polarized, including the three biggest ones: the EU28, NAFTA and the Far East. These destinations absorbed 2% of the volumes traded last year (1.35 million mT of finished products). Unlike the canned tomato category or even, to a lesser extent, the paste category, the worldwide market for tomato sauces and ketchup involves a relatively high number of exporting countries, including several who only operate as second-stage processors, with a size ratio close to 23 between the biggest of them (the USA) and the last of the Top16 (South Africa) over the 2016/2017 marketing year.

The volumes of sauce absorbed over the past marketing year have only been 1.4% (16 200 mT) higher than those recorded the previous year. The relative dispersion of both supply and consumption regions, which is clearer for this category than for pastes and canned tomatoes, minimizes to an extent the effects of ordinary annual variations. Indeed, there were few significant shifts in trade flow last year and they were minimal. Two regions (NAFTA and EU13) recorded decreases in trade volumes, while four others (Far East, Central America, North Africa and Southern Africa) recorded increases. The most noticeable drops affected US sales of sauces to Canada, and Dutch exports to the United Kingdom, Hungary, the Czech Republic and Lithuania. Polish sales to the United Kingdom also dropped last year.
In the final count, the world's two main leaders (USA and Netherlands) lost a few market shares, but these drops remained minimal. However, the very slight overall increase for this category benefited several secondary operators like Spain, Portugal, Egypt, Mexico, etc.
In the final count, the world's two main leaders (USA and Netherlands) lost a few market shares, but these drops remained minimal. However, the very slight overall increase for this category benefited several secondary operators like Spain, Portugal, Egypt, Mexico, etc.

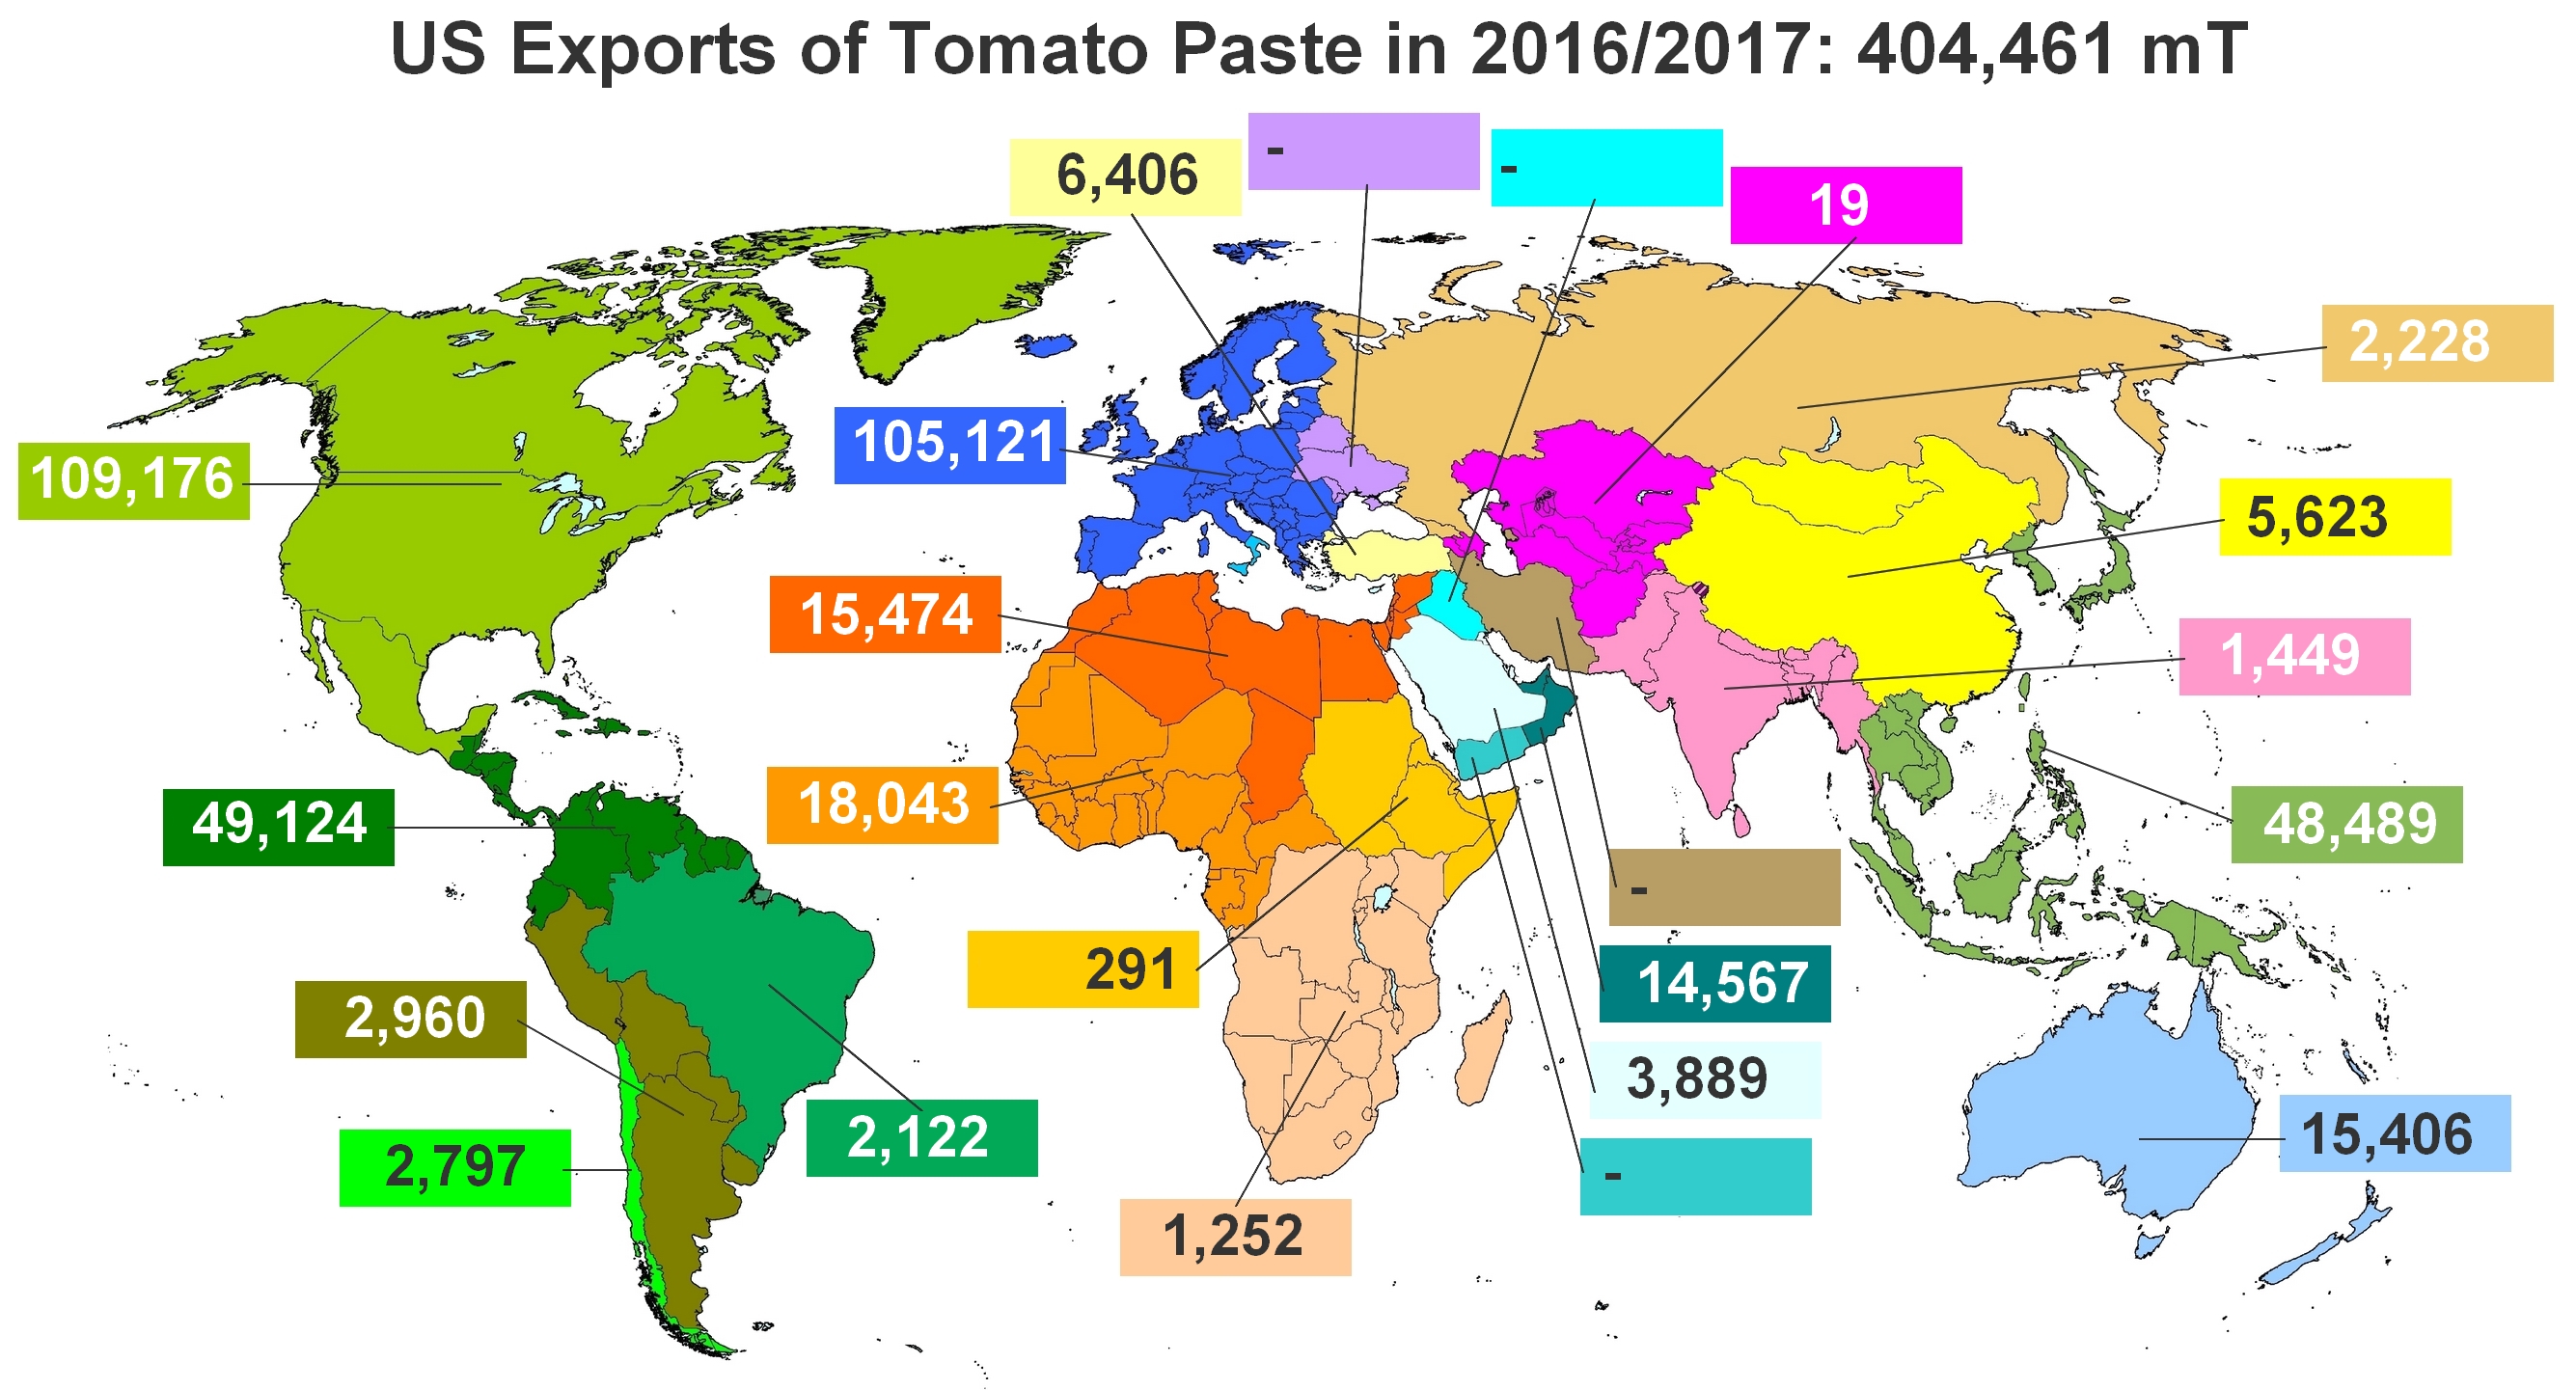
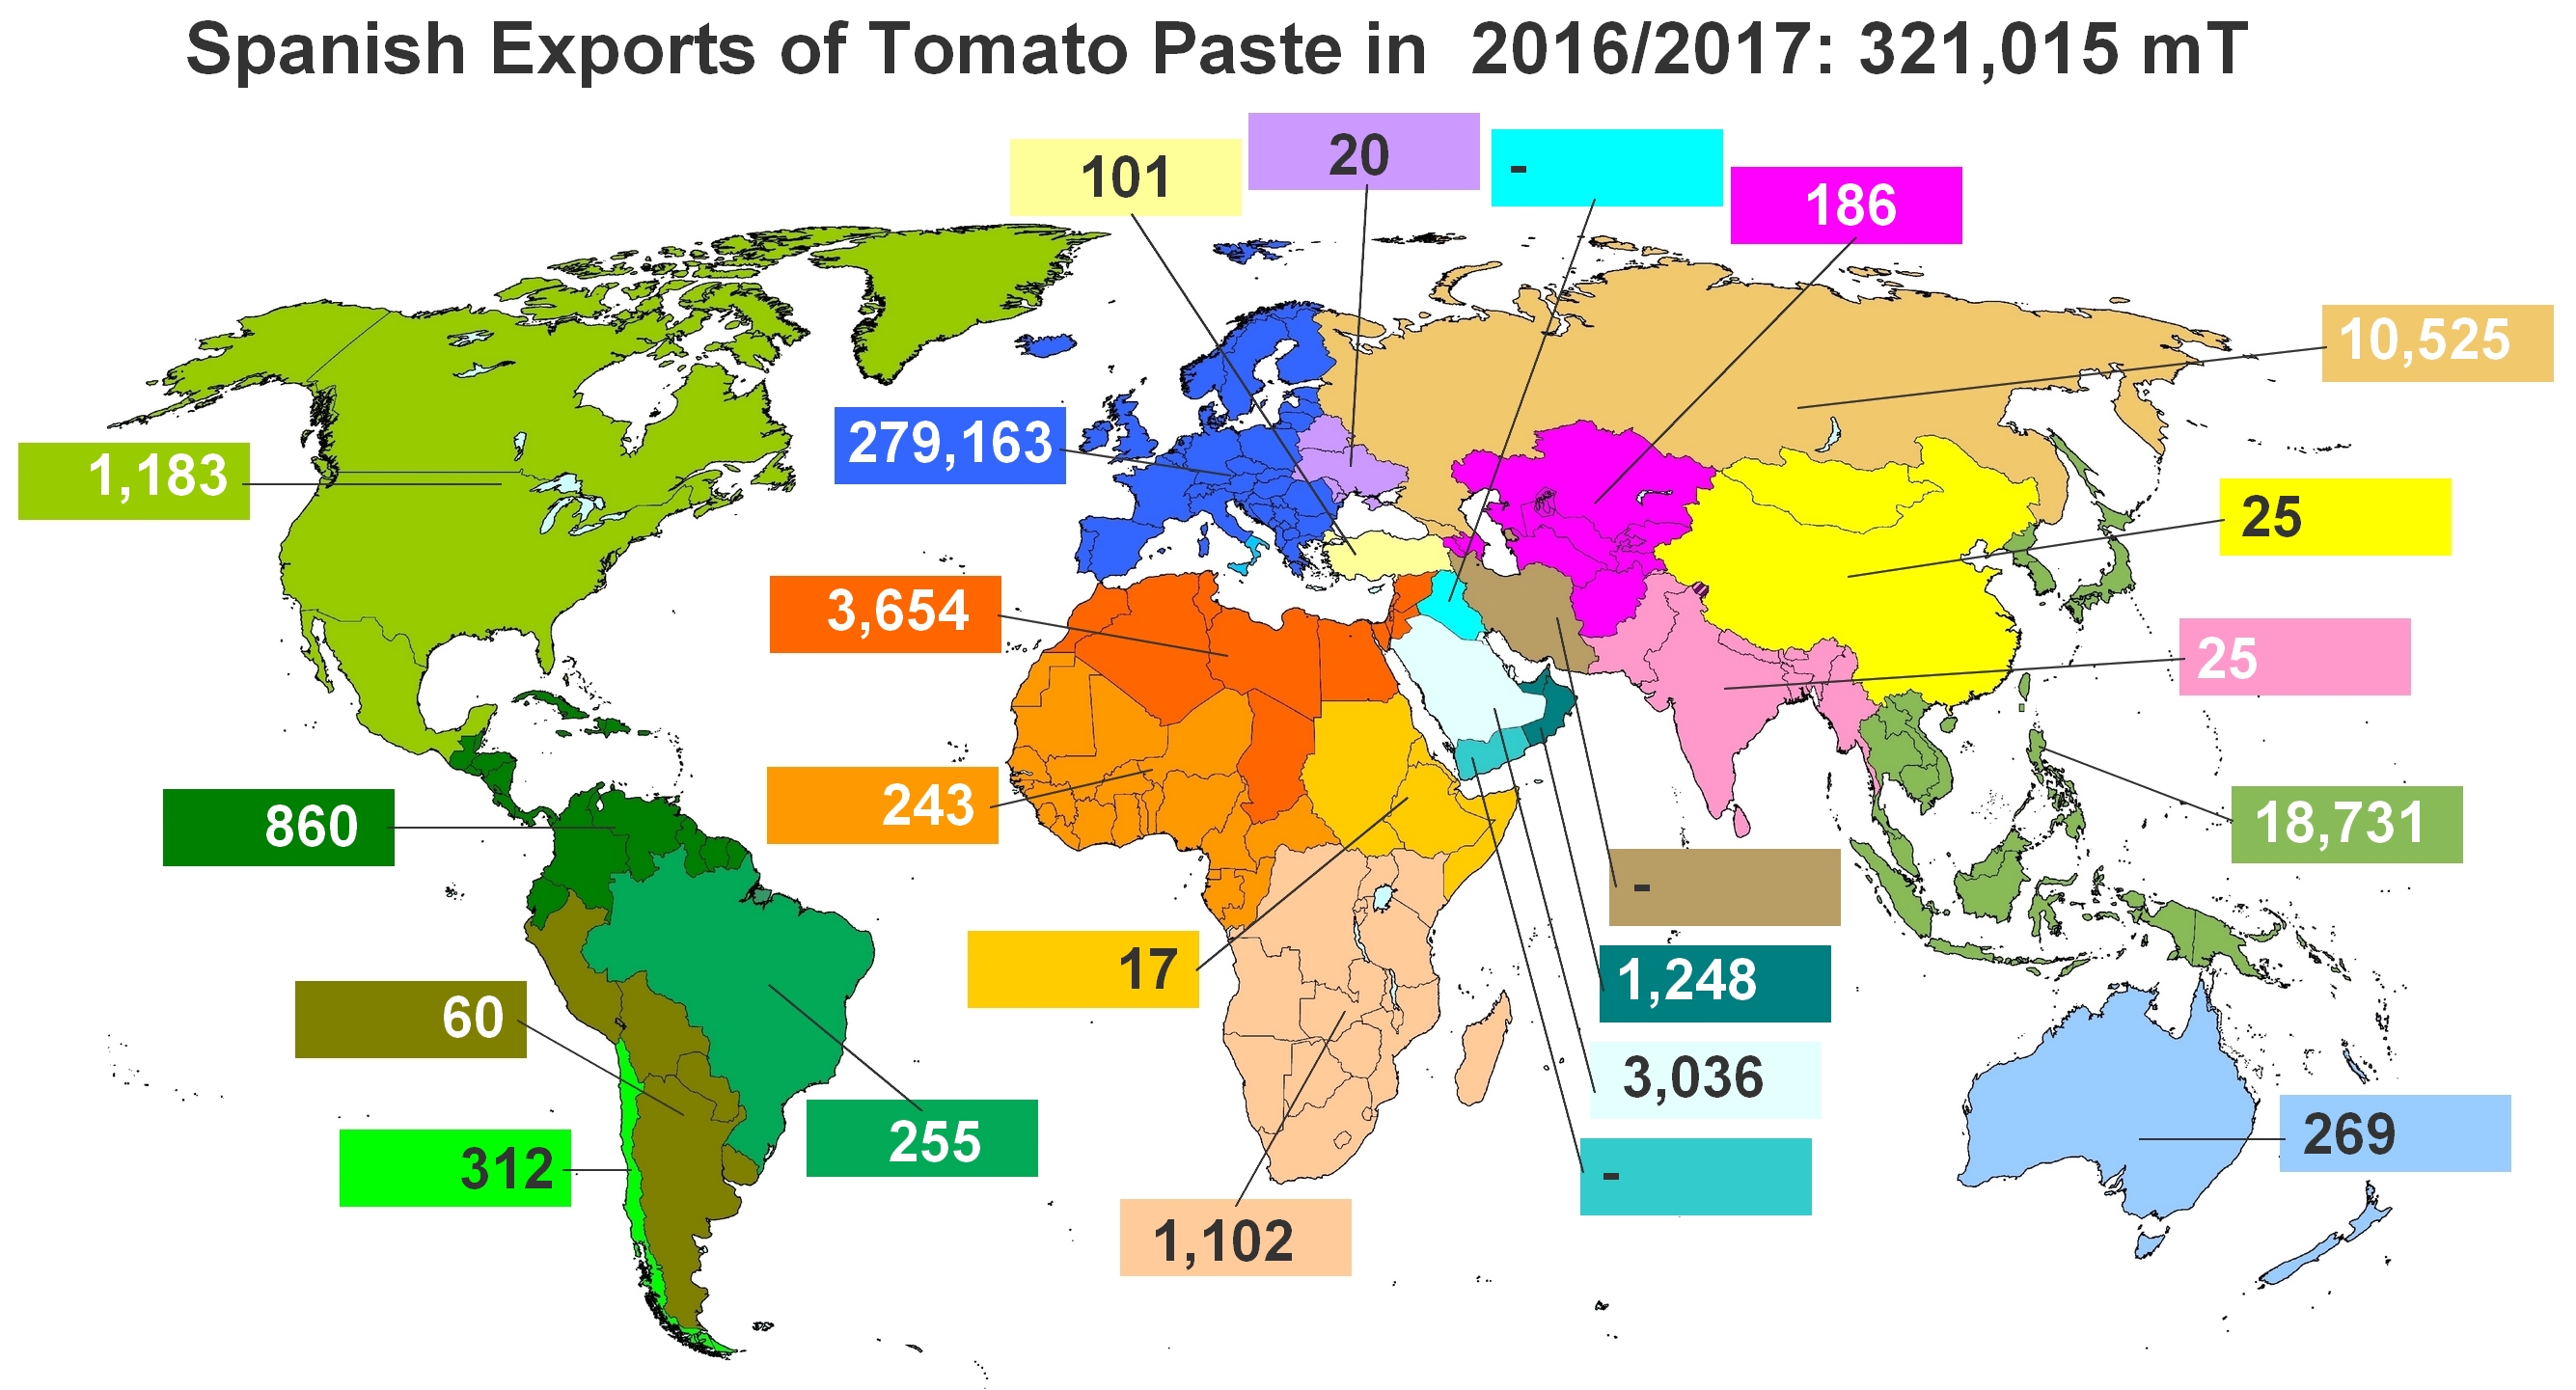
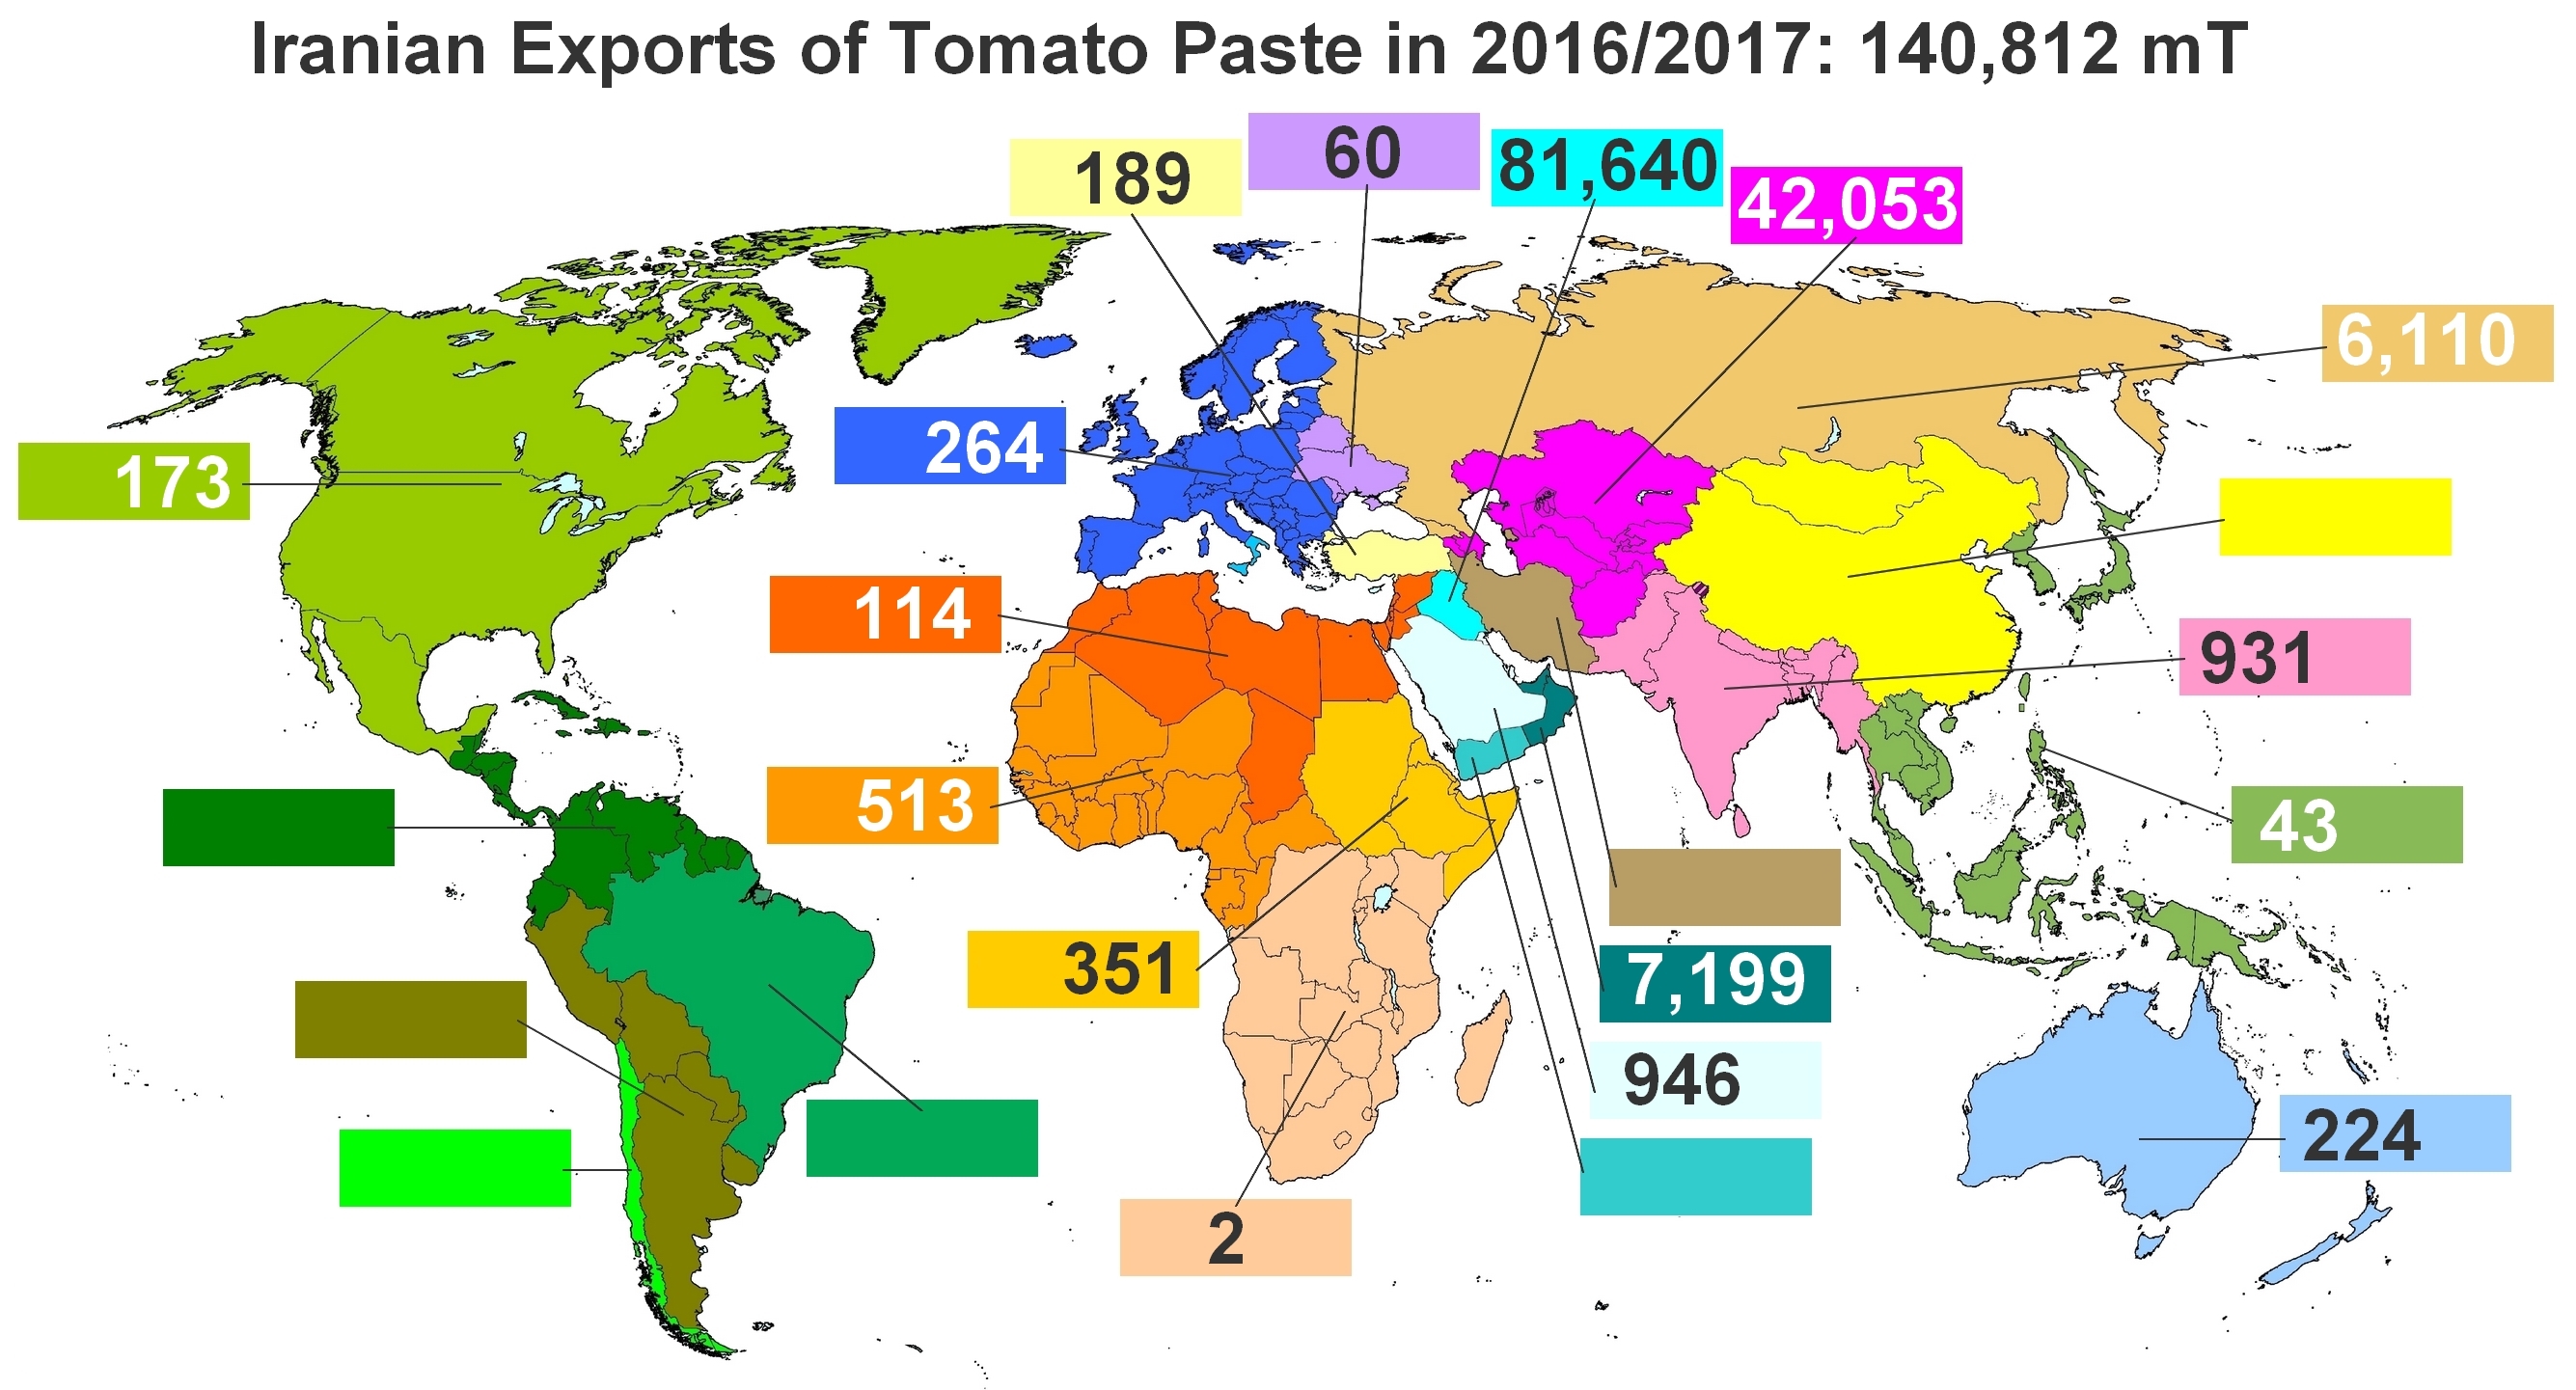
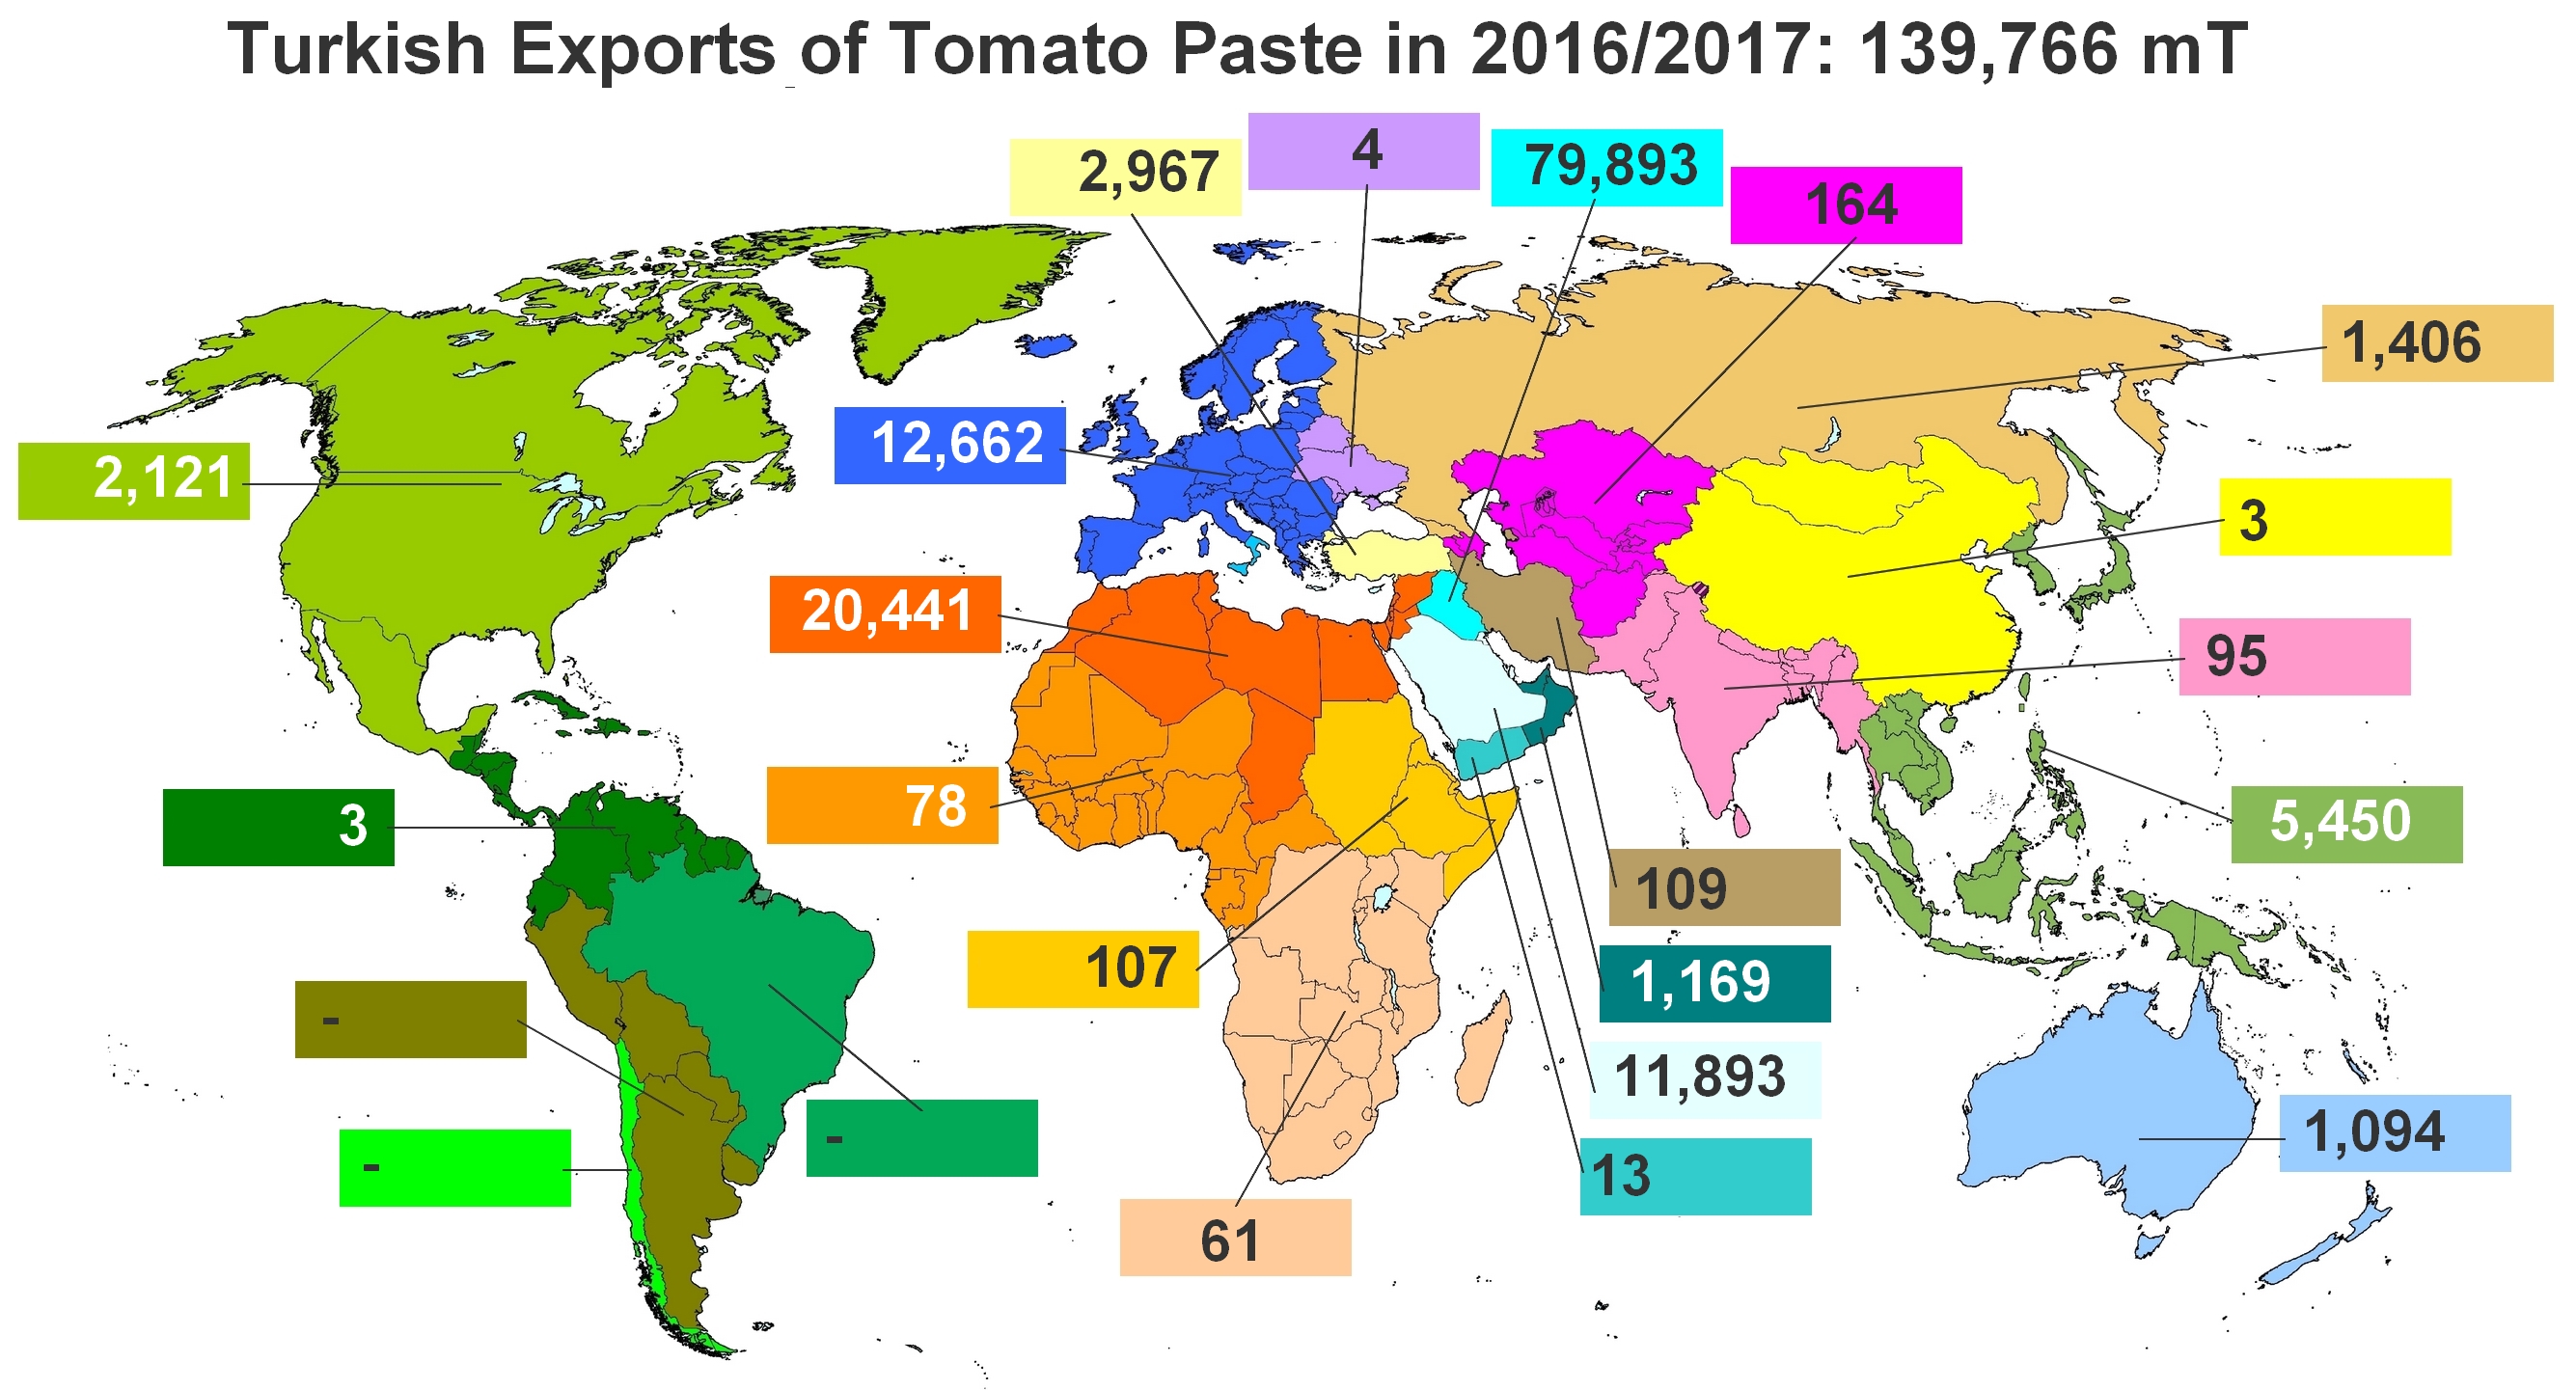
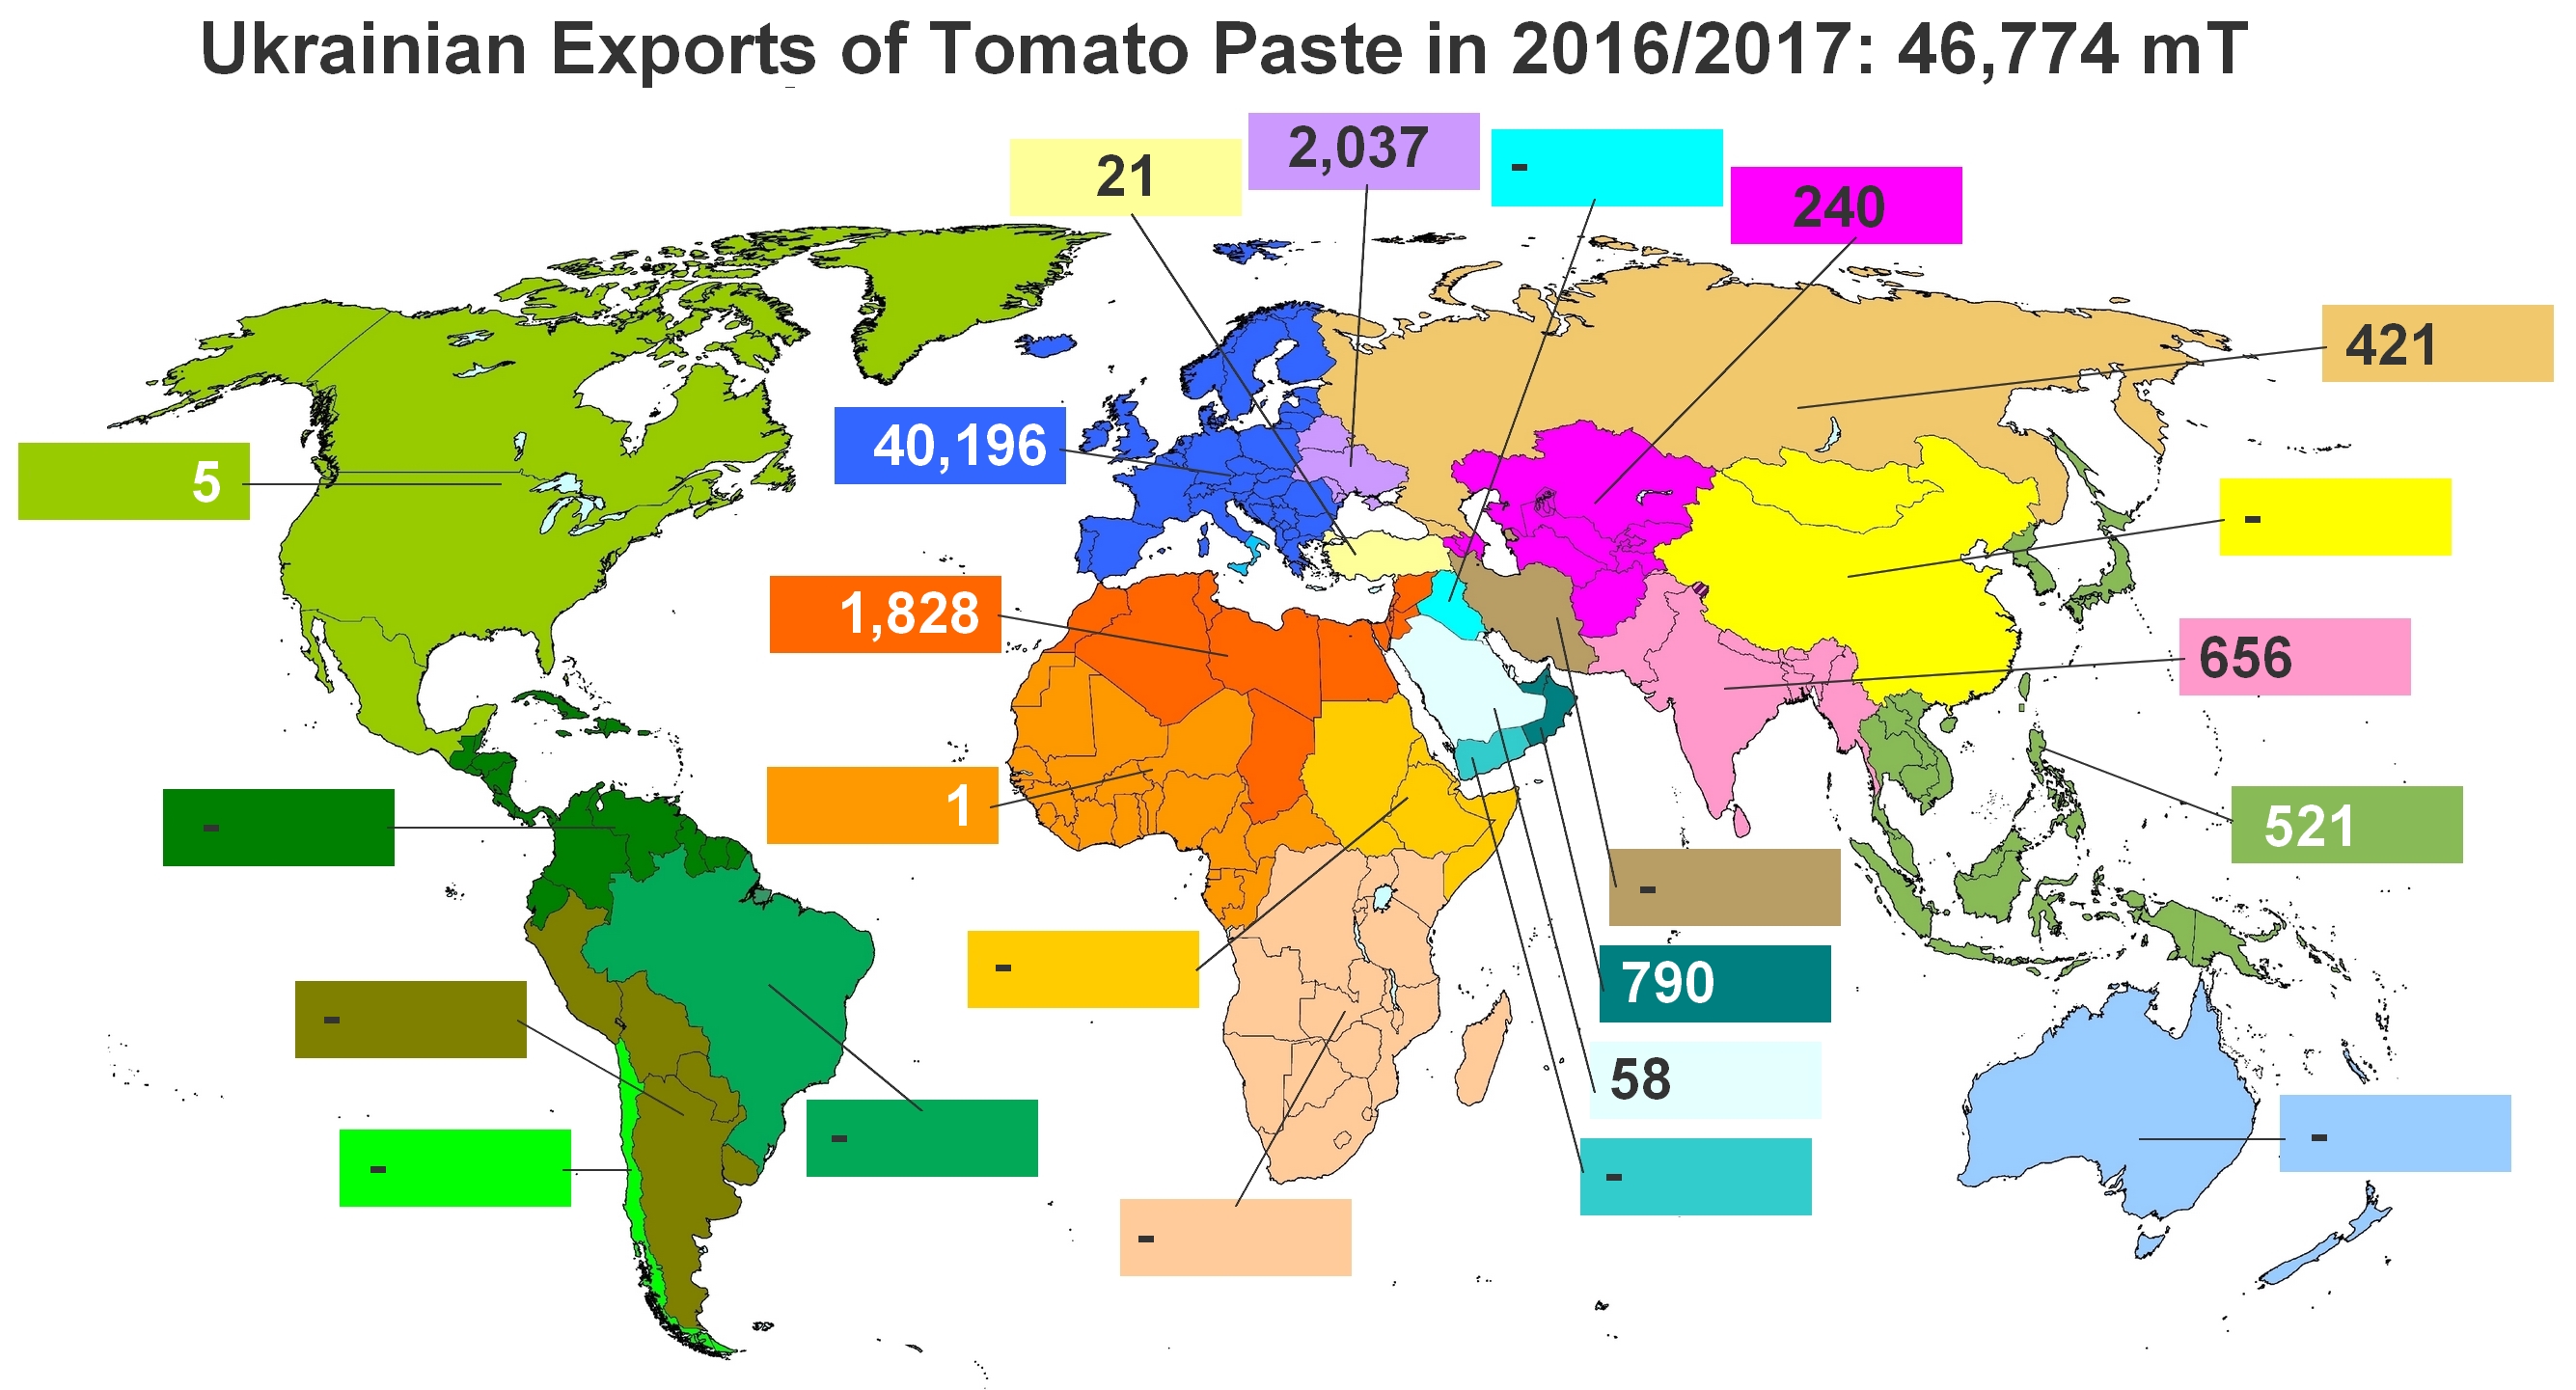
Results for the main tomato paste exporting countries over the past marketing year (2016/2017).
China:

Italy:

USA:
Spain:
Portugal:

Iran:
Turkey:
Chile:

Ukraine:
The tonnage indicated for sources and destinations is reported in total tonnage – the diagram only illustrates trade movements involving more than 10 000 mT of paste.
The tonnage indicated is total tonnage – the diagram only illustrates trade movements involving more than 5 000 mT of canned tomatoes.
The tonnage indicated is total tonnage – the diagram only illustrates trade movements involving more than 5 000 mT of sauces.
Source: HIS, Tomato News


