News
Globally, trade is down, but 5% up on the pre-Covid period
After two exceptional marketing years in more ways than one, 2021/2022 was a year of adjustment; for a variety of reasons, global operations have shown signs of slowing, while maintaining levels well above those of the pre-Covid period.
After two exceptional marketing years in more ways than one, 2021/2022 was a year of adjustment; for a variety of reasons, global operations have shown signs of slowing, while maintaining levels well above those of the pre-Covid period.
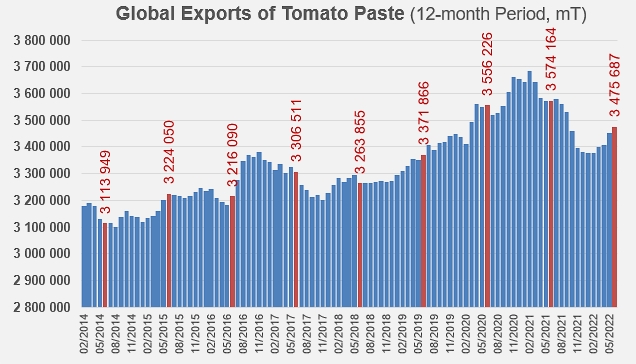
Total tomato paste volumes (HS Codes 200290) exported globally during the July 2021/June 2022 marketing year reached 3.476 million metric tonnes (mT) of finished products. So overall activity is down by just under 100,000 mT (-3%) compared with the previous marketing year and by just under 25,000 mT compared with the average of the previous three years (period running 2018/2019 – 2020/2021). However, the last two marketing years have been deeply disrupted by the effects of the Covid pandemic, so the 2021/2022 performance is much more meaningful when compared to the average activity of the three years prior to the health crisis (2016/2017, 2017/2018, and 2018/2019). The quantities mobilized last year were more than 161,000 mT higher (+5%) than those shipped before the consumption and trade boom in spring 2020 (about 3.31 million mT of finished products).
The 2021/2022 marketing year was notably marked by a peak in monthly operations (348,000 mT) last March, the level of which was just below the four record months recorded in March, April, October and November 2020 (between 353,000 and 366,000 mT traded).
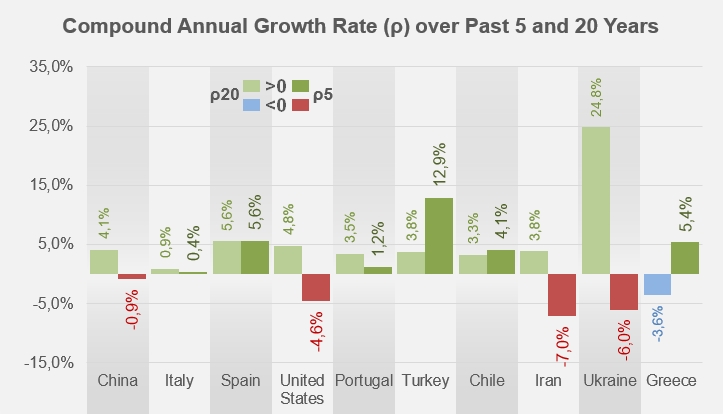
As we have already had occasion to mention (see our related articles below), this latest marketing year has confirmed a number of national trajectories. Chinese results, although the country is leader in the paste category, recorded a further decline, putting them well below the levels of the previous year (-6%) but also of the pre-Covid years (-8%). Over the last five years (i.e. since 2016/2017), Chinese operations have been declining at a CAGR of -0.9% per year. US exports of paste, although they increased slightly during the pandemic, were 13% lower in 2021/2022 than before the health crisis. Over the past five years, US foreign sales have contracted at an average annual rate of -4.6%. The situation is even more worrying for the Iranian industry, whose exports fell in 2021/2022 by 35% compared to their average level of the last three years (2018/2019 – 2020/2021), but especially by 17% compared to their average level before Covid. Iran's commercial trajectory over the last five years has followed a strong downward trend, at an average CAGR of -7% per year.
In the case of Ukraine, the result of the marketing year shows something of the gravity of the impact of last February's Russian invasion. Total estimated activity for the last four months of the marketing year (March-June 2022, approximately 2,600 mT) fell by approximately 85% compared with the corresponding periods of previous years, whereas the first eight months of the marketing year had shown an increase of 3% over the previous year and 72% compared with the pre-Covid period.
In the case of Ukraine, the result of the marketing year shows something of the gravity of the impact of last February's Russian invasion. Total estimated activity for the last four months of the marketing year (March-June 2022, approximately 2,600 mT) fell by approximately 85% compared with the corresponding periods of previous years, whereas the first eight months of the marketing year had shown an increase of 3% over the previous year and 72% compared with the pre-Covid period.
But the 2021/2022 marketing year has also confirmed the good performance of exports of several leading industries such as Italy, whose result shows a 5% increase compared to the period before Covid, Portugal (+4% compared to the same period), Spain (+14%), and especially Chile (+23%), Greece (+37%) and Turkey (+89%).

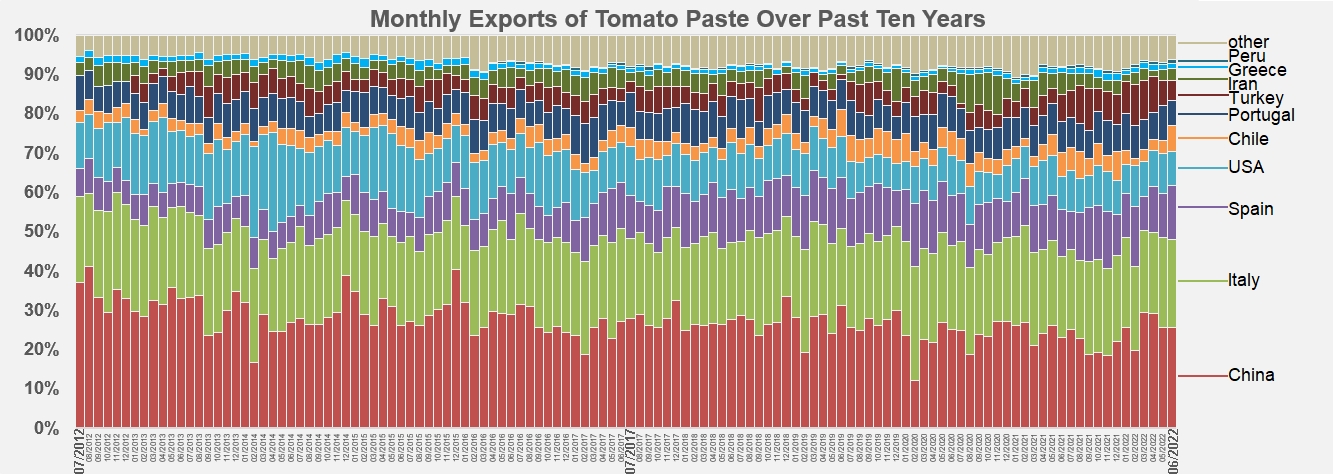
The main players of this marketing year were Chinese and Italian products, which together accounted for a little more than 45% (1.58 million mT) of total operations. But Spanish, Californian, Portuguese and Turkish pastes also played a role, with a total (about 1.29 million mT) accounting for a little more than 37% of the exports recorded over the year, supplemented by quantities mobilized by Iran, Ukraine and Greece (188,000 mT in total, i.e. about 5% of worldwide trade in 2021/2022). The operations of "other countries" involved approximately 261,000 mT of pastes, i.e. 7.5% of the quantities shipped during the year.
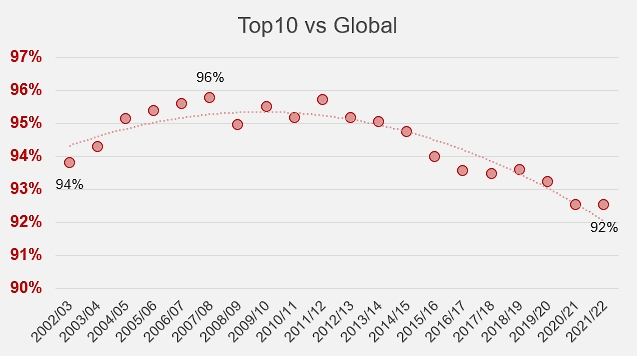
However, it is clear that the influence of the leading industries is slowly but steadily being eroded. While exports from all TOP10 countries fell by the same amount as overall operations over the 2020/201 marketing year (-2.8%), the increase compared to the pre-Covid period has been less spectacular (+3.7% instead of 5%). At the same time, export operations from "other countries" declined by only 2.5% compared to the previous year, but increased by almost 22% compared to the period before Covid. In short, over the last five years, the annual level of activity of the TOP10 has grown more slowly (0.8% per year) than overall activity (1% per year) and especially less quickly than the activity of the industries that are not part of the TOP10 list (+4%).
These different dynamics, aggravated by weather issues, have resulted in a weakening of the position of the TOP10 industries, which in 2021/2022 accounted for "only" 92% of overall export activity, whereas they held nearly 96% in 2007/2008.
Some complementary data
Comparison of average annual export growth rates over the last five years and the last twenty years for the ten main exporting industries worldwide.
Comparison of average annual export growth rates over the last five years and the last twenty years for the ten main exporting industries worldwide.
Distribution of monthly exports of pastes over the last ten years.
Sources: Trade Data Monitor


