News
Japan: a heavy reliance on imports for tomato products in 2025
Marked by a heavy reliance on imports, the Japanese market for tomato products shows a structural trade deficit that peaked at USD 460 million in 2024 before receding in 2025. Driven by rising global prices and subsequently by a geographic shift in trade flows, this dynamic is mainly shaped by paste and canned tomatoes—categories in which Japan ranks as the world’s fourth-largest buyer—compared to a much smaller sauces sector.
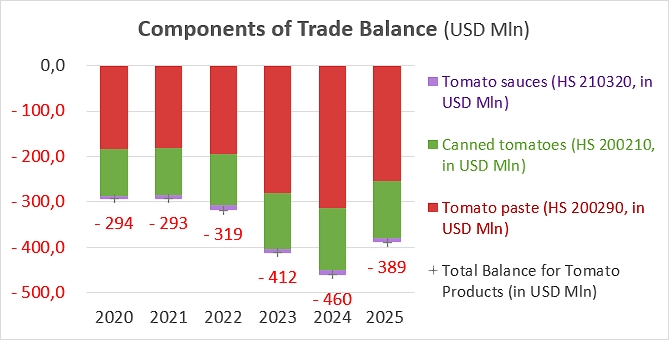
Japan shows a marked and structural trade deficit across all industrial tomato products, reflecting its high import dependency previously noted in our March 2023 analysis. Over the recent period, the overall deficit widened significantly, rising from USUSD 293 million in 2021 to a peak of USD 460 million in 2024, before recording a clear decline to USD 389 million in 2025, representing a 15% drop year-on-year. This trend highlights a particularly strong price effect: while trade balances by product category remained relatively stable throughout the period, the financial value of trade surged due to higher global commodity prices and logistics costs, before adjusting downwards in 2025.
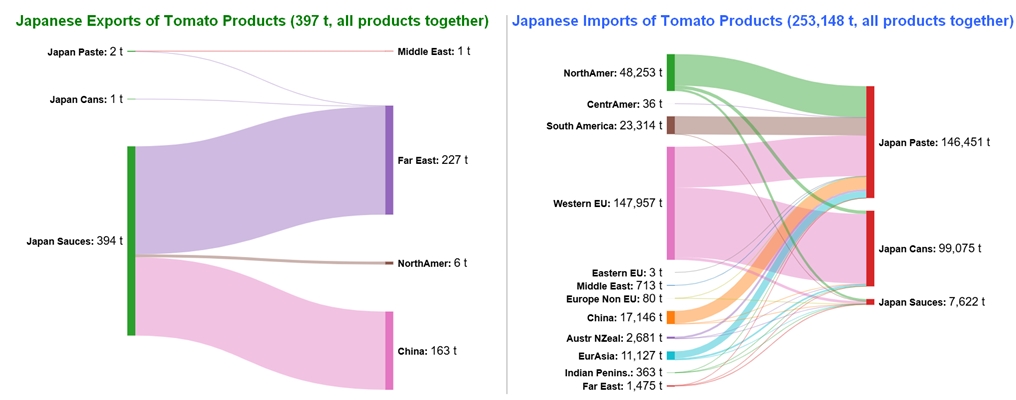
In volume terms, Japanese exports of industrial tomato products are virtually non-existent for paste and canned tomatoes, and extremely low for sauces. Tomato pastes accounts for the largest share of trade: in this sector alone, Japan’s trade deficit went from nearly 150,000 metric tons in 2021 to over 155,000 metric tons in 2024, before dropping back to around 146,000 metric tons in 2025, down 6% year-on-year. For their part, canned tomatoes remained very stable, with volumes close to 99,000 metric tons in 2025—a level identical to 2024 and very close to the three-year average. Finally, tomato sauces represent a much more modest and steady volume, with a trade deficit of 7,200 metric tons in 2025 compared to 7,300 metric tons in 2024.
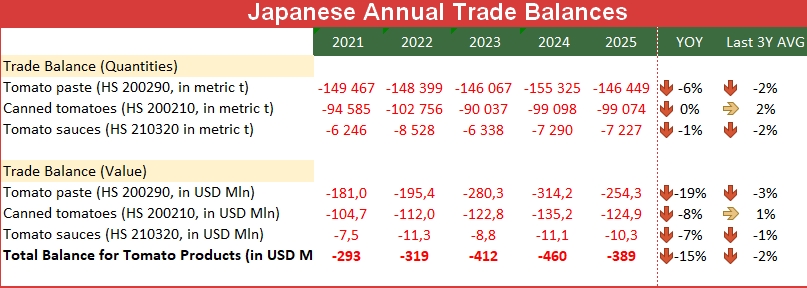
In value terms, tomato paste accounts for nearly two-thirds of the total bill, reaching a deficit of USD 254.3 million in 2025 after peaking at USD 314.2 million in 2024. Canned tomatoes follow a similar trajectory, with an annual deficit of USD 124.9 million in 2025, down 8% year-on-year. Finally, prepared sauces account for a marginal share of the trade balance with a deficit of USD 10.3 million. The easing observed in 2025 is explained by the combined drop in imported paste volumes and the softening of international prices for processed tomato products.
The analysis of Japanese tomato paste imports by region of origin between 2020 and 2025 highlights a marked geographical shift in sourcing. In total, Japan imported 146,451 metric tons of paste in 2025, down 5.7% from the peak reached the previous year (155,326 metric tons). The scale and regularity of these flows enable the country to capture approximately 5.4% of global imports, ranking as the fourth-largest buyer worldwide.
Western Europe remains historically the leading supplier to the Japanese market, but its share is undergoing a clear, steady erosion. After peaking at 72,737 metric tons in 2020, tomato paste shipments from Western Europe (Portugal, Italy, Spain) fell to 53,388 metric tons in 2025, representing a noticeable drop of 11% year-on-year and an average contraction of 15% over the last three years.
In response to this European decline, North America (USA, California) has established itself as a major, more stable supply pillar. Despite a slight dip in 2025 to 41,014 metric tons (-7% year-on-year) after a high of 44,006 metric tons in 2024, the region shows a positive dynamic with an average increase of 5% over three years, consolidating its position as Japan’s second-largest supplier.
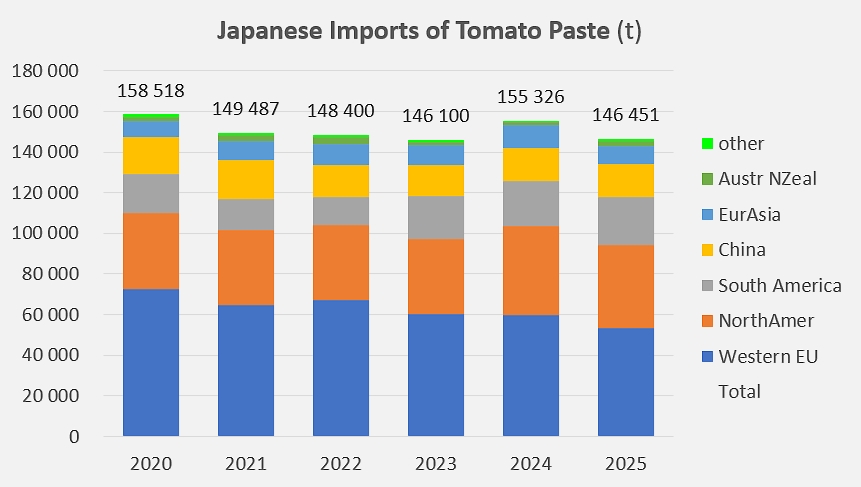
The most remarkable growth is observed in South America (Chile), which has recorded sustained growth in its deliveries. South American volumes increased from 13,785 metric tons in 2022 to 23,304 metric tons in 2025—up 7% compared to 2024 (21,200 metric tons)—showing a spectacular average progression of 24% over the last three years.
For its part, China maintains a steady and predictable supporting role. Its exports to Japan show great stability, reaching 16,328 metric tons in 2025, virtually unchanged from 2024 and up by an average of 3% over three years.
Finally, secondary suppliers have experienced mixed fortunes. Eurasia (Turkey) suffered a sharp decline to 8,960 metric tons in 2025 (-21% year-on-year), whereas Australia and New Zealand recorded a strong rebound to 2,566 metric tons (+78% compared to 2024, +25% over three years), confirming the slow but growing diversification of Japan’s supply sources.
The geographical profile of Japanese canned tomato imports reveals an extremely concentrated market structure with strong overall stability. In total, Japan imported 99,075 metric tons in 2025, essentially flat compared to 2024 (-0.1% year-on-year) and up slightly by an average of 1.8% over the last three years. Japan absorbs 5.7% of global canned tomato imports and has maintained a very stable fourth-place global ranking throughout the period.
Western Europe (Italy) holds a structural near-monopoly on this segment, supplying virtually all volumes. In 2025, it exported 91,108 metric tons to Japan, accounting for approximately 92% of the total Japanese canned tomato market. Despite minor annual fluctuations—such as a low point of 83,532 metric tons in 2023 followed by a rebound in 2024—the region shows a solid trajectory with average three-year growth of 1% (-1% between 2024 and 2025).
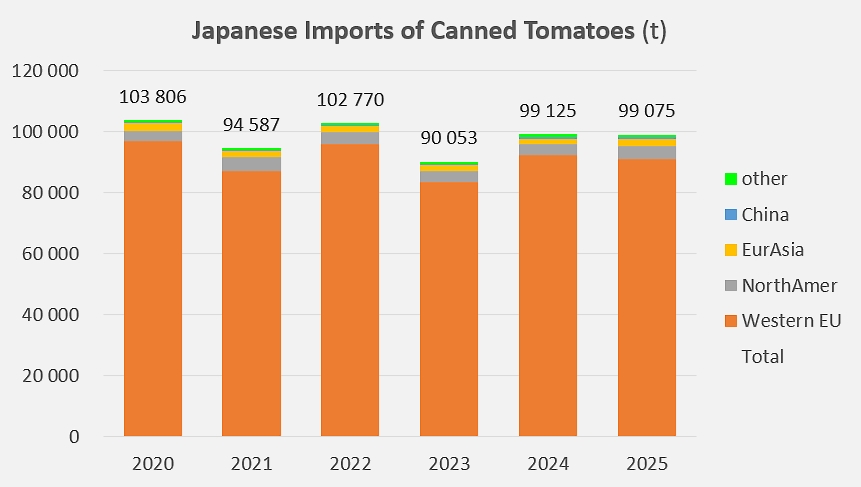
Far behind the European dominance, North America (USA) stands out as Japan’s second-largest supplier with 4,275 metric tons in 2025. This flow shows steady growth following a low point in 2023 (3,669 metric tons), recording an 11% increase year-on-year and a dynamic average growth of 12% over the last three years.
Other supplying regions account for secondary volumes but have experienced strong relative growth in some cases. This is true for Eurasia (Türkiye), which rebounded to 2,130 metric tons in 2025 after a dip in 2023 and 2024, as well as China (791 metric tons, +40% year-on-year) and the Indian Peninsula (314 metric tons, +68% from 2024 to 2025), both posting high three-year growth rates despite remaining marginal in volume. Conversely, shipments from Australia and New Zealand plummeted to 111 metric tons in 2025 (-68% year-on-year).
Japanese imports of tomato sauces and ketchup between 2020 and 2025 highlight a market characterized by modest volumes, high geographic dispersion, and a recent redistribution of trade flows. In total, Japan imported 7,621 metric tons in 2025, virtually unchanged from 2024 (+0.7% year-on-year) and aligned with the three-year average (-0.3%). Unlike paste or canned tomatoes, the country holds only a secondary global position in this segment (ranking 40th, with approximately 0.5% of global imports).
Western Europe remains the main supplier to the archipelago, showing a clear rebound in 2025. After two years of decline (2,759 metric tons in 2023, then 2,535 metric tons in 2024), shipments from Western Europe (the Netherlands) grew by 37% to reach 3,461 metric tons, posting an average three-year increase of 16% and representing nearly 45% of Japan’s total imports.
North America (USA) has established itself as the second-largest supply hub, benefiting from a major step-change since 2024. After remaining below the 1,500-metric-ton mark through 2023, North American deliveries nearly doubled to 2,863 metric tons in 2024 and continued their upward trend in 2025 to 2,964 metric tons (+4% year-on-year, +55% on average over 3 years).
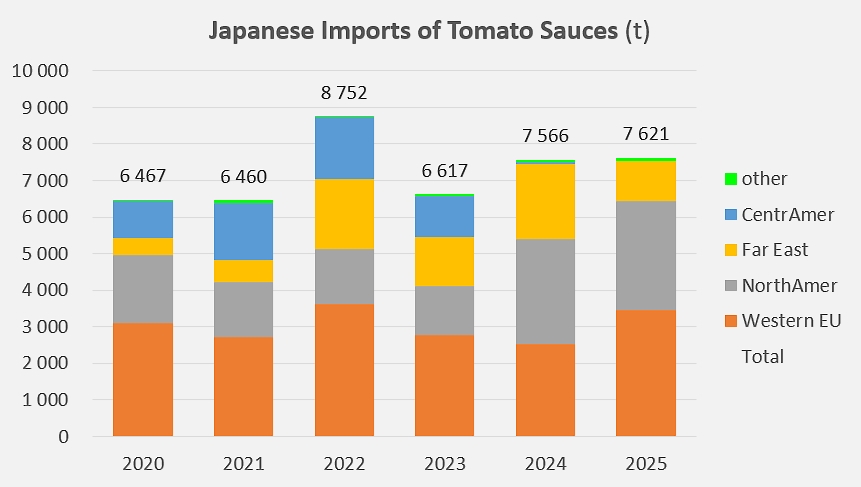
Conversely, imports from the Far East suffered a sharp drop. After a peak of 2,066 metric tons in 2024, volumes imported from this region, particularly from Thailand, fell by 46% in 2025 to 1,115 metric tons, posting an average three-year decline of 37%.
The collapse of flows from Central America (Mexico) is also noteworthy; these represented over 1,700 metric tons in 2022 before falling sharply until disappearing completely in 2025. Other supplying regions (Eurasia, China, Australia/New Zealand, South America) account for only marginal volumes.
In conclusion, the Japanese market for tomato products remains structurally dependent on imports and highly sensitive to global price fluctuations. The lower costs in 2025 mask a profound shift: the archipelago is diversifying its supply sources by reducing its European share in favor of North America and Chile.
Some complementary data
Breakdown of the Japanese trade balance deficit for tomato products by product category between 2020 and 2025 (in million US dollars).
Japanese foreign trade for tomato products, by region of origin and product type.
Source: TDM