News
Global Tomato Paste Trade in 2025/2026: slow emergence of secondary origins
Over the past two decades, the global tomato paste trade has experienced remarkable expansion, with traded volumes now reaching around 4 million metric tonnes per year. This dynamic is accompanied by profound shifts, characterized by China’s rising dominance in volume, the resilience of historical processing countries, and the slow emergence of secondary origins that marginally erodes the hegemony of the Top 10. Finally, the recent surge in financial values highlights a persistent unit valuation gap between major Western production basins and their direct competitors.
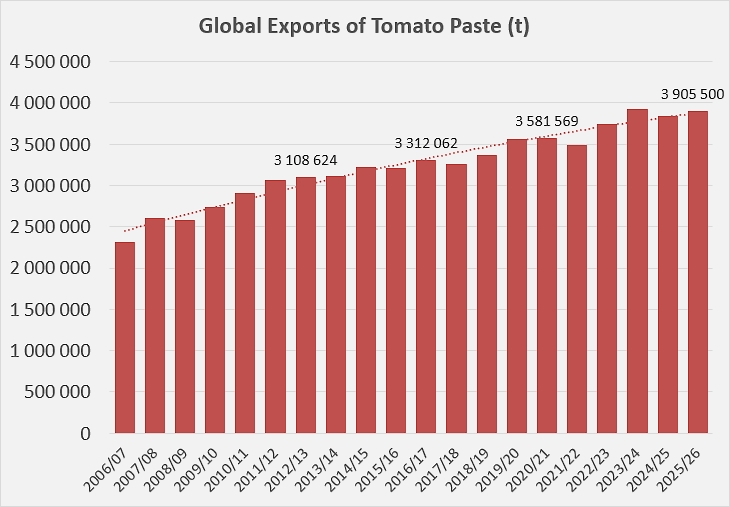
Over the twenty-year period from 2006/07 to 2025/26, global annual tomato pastes exports followed a remarkable growth trajectory, rising from 2.22 million tonnes to 3.9 million tonnes—a surge of nearly 76% in two decades. This steady development saw the global market cross the 3-million-tonne threshold in 2012/13, and then the 3.5-million-tonne mark in 2019/20, demonstrating structural expansion in the international trade of this product. Over the past five years, marked notably by the COVID health crisis, the trend remained upward despite minor regulatory fluctuations. After a temporary dip in 2021/22 to 3.49 million tonnes, the sector accelerated sharply with successive increases of 7.3% in 2022/23 and 4.9% in 2023/24; this marketing year set an all-time record for the period and in the global history of the sector, with 3.92 million tonnes traded. The slight decline observed in 2024/25 to 3.84 million tonnes quickly gave way to a recovery in 2025/26, reaching nearly 3.91 million tonnes. The past five marketing years confirm the global market’s long-term consolidation on a high plateau of activity, hovering very close to the symbolic threshold of 4 million tonnes per year.
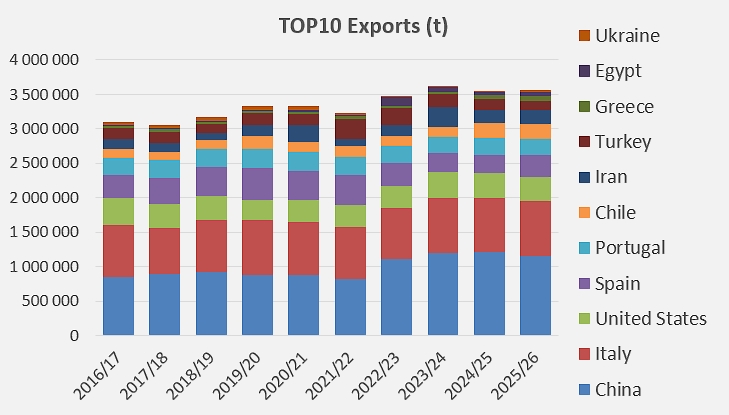
In the individual rankings of processing/exporting countries, China confirms its undisputed leadership with particularly impressive momentum in recent years. After remaining below the 900,000-tonne mark until 2021/22, China made a dramatic leap forward in 2022/23 to pass 1.1 million tonnes and peak at 1.2 million tonnes in 2024/25, before stabilizing at 1.15 million tonnes in 2025/26. Behind this giant, Italy maintains its position as a solid global number two with strong consistency, as its exports oscillated mainly between 740,000 and 800,000 tonnes per year to reach 797,965 tonnes in 2025/26.
The United States rounds out the podium with more moderate but stable volumes of around 360,000 tonnes toward the end of the period (359,600 tonnes in 2025/26). In Iberian Europe, Spain experienced a net erosion in volumes from its 2019/20 peak (463,800 tonnes), stabilizing around 311,000 tonnes in 2025/26, while Portugal showed a slightly declining but relatively controlled trend, standing at 233,800 tonnes in 2025/26.
Among the most notable developments in the rest of the ranking, Chile experienced steady expansion to reach 216,200 tonnes in 2025/26, overtaking Turkey, whose volumes gradually declined to 137,600 tonnes after peaking at 279,000 tonnes in 2021/22. Iran confirmed its presence despite regular fluctuations (201,700 tonnes in 2025/26), while Greece posted impressive growth, almost doubling its foreign sales in the recent period to reach 73,489 tonnes. Finally, countries such as Egypt (55,000 tonnes), Peru (50,300 tonnes), or Turkey periodically readjust the balance of the Top 10, whereas Ukraine suffered a sharp decline in its export capacity starting in 2022/23 due to the geopolitical context, falling back to 29,300 tonnes in 2025/26 after exceeding 60,000 tonnes in the past.
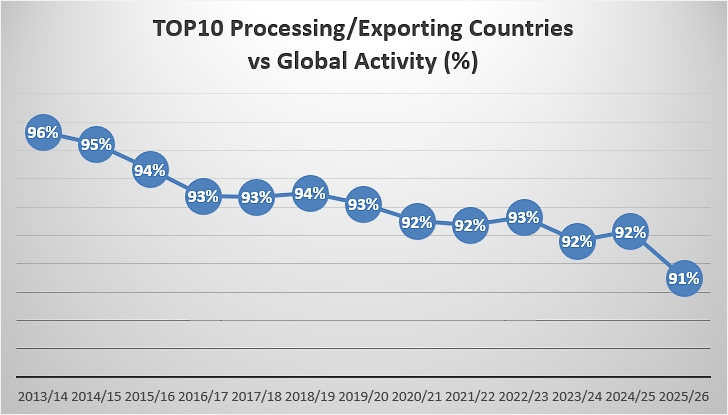
The distribution of global tomato paste exports highlights a heavy concentration of supply in the hands of the top ten processing countries, even if their dominance is eroding slightly in favor of secondary players. Although the composition of this group has varied slightly over the past twelve or thirteen marketing years, market share trends from 2013/14 to 2025/26 highlight an absolute, yet clearly declining, dominance by the primary tomato paste processing/exporting countries. At the beginning of this period, industry concentration was extreme: the global Top 10 accounted for 96% of global exports in the 2013/14 season, with nearly 2.98 million tonnes out of a total of 3.11 million tonnes. Over time, although absolute volumes exported by this small group grew to reach nearly 3.54 million tonnes in 2025/26, its relative share steadily eroded to 91%, marking a 5-percentage-point decline in thirteen years.
This dynamic reflects the concurrent expansion of other non-Top 10 exporting countries, which are managing to gain ground steadily in the international market. In 2013/14, these secondary players accounted for only 4% of global trade in the sector, moving just 135,000 tonnes. Their presence grew steadily over the past two decades: their share of the global market rose to around 6% in 2015/16 (nearly 182,000 tonnes), stabilized around 7% to 8% for most of the recent period, and then reached a new milestone of 9% in the 2025/26 marketing year, with a record volume of over 370,000 tonnes. This growth in secondary origins, whose exports more than doubled in absolute volume, points to a slow but very real diversification of the global supply map.
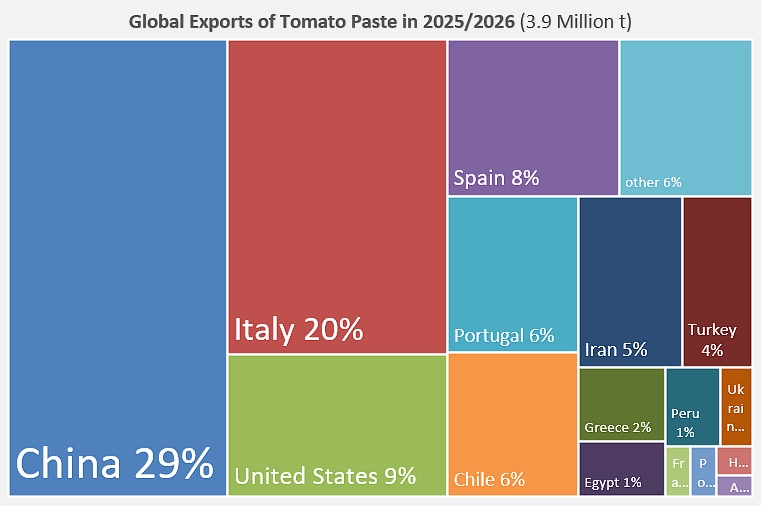
In the 2025/26 marketing year, the global tomato paste export market remained heavily dominated by a leading duo: China holds the top global position with a 29% share (1.15 million tonnes), followed by Italy at 20% (797,965 tonnes). Together, these two giants control nearly half of all internationally traded volumes.
Behind this pair, a group of five major players accounts for one-third of international trade: the United States (9%), Spain (8%), Portugal (6%), Chile (6%), and Iran (5%). Turkey (4%) and Greece (2%) fill out the significant intermediate positions. Finally, countries like Egypt, Peru, or Ukraine each account for about 1% of flows, while other global origins combined represent 6% of the total market share.
In financial terms, the global tomato paste export market experienced a dramatic surge followed by a adjustment phase. After remaining relatively stable at around USD 3 to 3.5 billion from 2015/16 to 2021/22, total export value spiked exceptionally to reach a historic peak of USD 5.54 billion in 2023/24, driven by global price inflation and rising input costs. The following two seasons marked a normalization in prices, with global revenues bringing the market back down to USD 4.72 billion in 2024/25 and USD 4.52 billion in 2025/26.
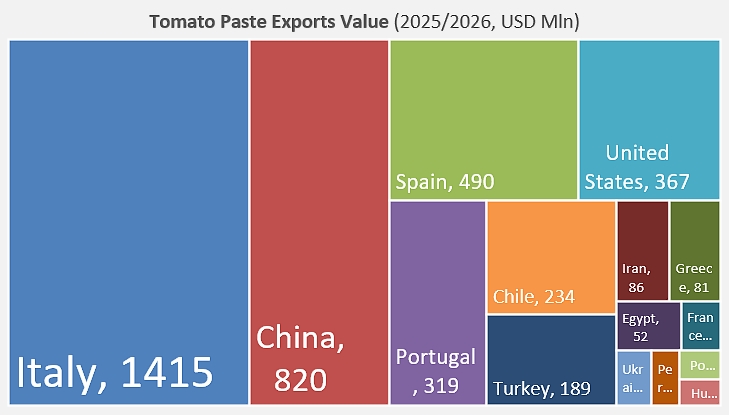
By country, the ranking by value differs significantly from that by volume: the Italian industry stands out as the undisputed global leader in value, with USD 1.415 billion in 2025/26 (and a peak at USD 1.414 billion in 2023/24), a position driven by strong unit valuations for its processed products. China, despite being first in volume, ranks second in financial value at USD 820 million in 2025/26 (after a peak of USD 1.376 billion in 2023/24). Behind this pair, Spain (USD 490 million), the United States (USD 367 million), and Portugal (USD 319 million) round out the top commercial group, in an overall ranking that reflects a higher average unit value for Western products compared to other major production basins.
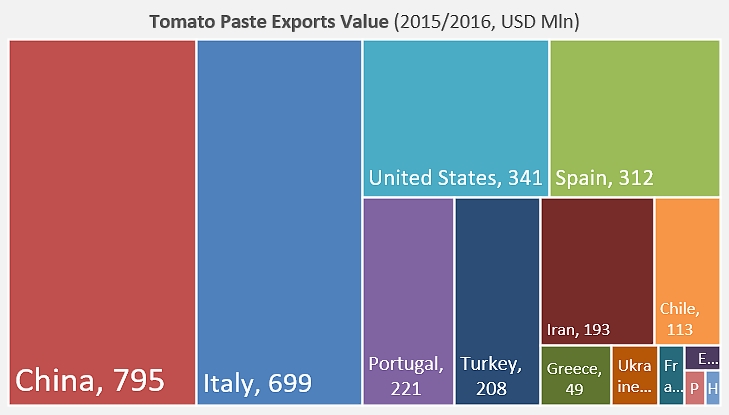
For comparison, national tomato paste export values in 2015/2016:
Interactive graph: Evolution of total tomato paste export by individual country (2006/07 to 2025/26)
You can change the country selection by selecting one or several countries of interest below the graph.
By default, the countries displayed are the TOP 10 countries during the last Marketing Year.
Source: TDM