News
Global Processed Tomatoes: What Our Plates Reveal in 2025
With statistical research by Mathias Chatelard, Economics Master’s student.
At Tomato News, we closely track the whole industry—from crop forecasts and prices to global events, weather forecasts, technology, innovations and legislation. This time, we are connecting these macro forces with the very end of the supply chain: how consumers actually use our products at home.
To find out, we recently bought a comprehensive market study from Euromonitor. We took their raw data on retail sales volumes (Retail Volume in metric tonnes) across 15 key countries for the year 2025. By focusing strictly on what people buy for their home kitchens—and leaving out bulk restaurant data and inflation spikes—we wanted to find the real culinary DNA of home cooking.
Mathias, an Economics Master’s student working with us, ran the data through a statistical technique called Principal Component Analysis (PCA). The goal was to cut through the noise and see if global tomato consumption changes with every passing trend. The short answer? It doesn’t. These habits are deeply cultural, and the data shows that the world basically splits into four distinct cooking profiles.
Behind the Maths: What Do the Percentages Mean?
To make sense of the data, we first had to remove a major statistical hurdle: country size. If we only looked at raw tonnages, the massive market of the United States would completely drown out smaller countries like Portugal, hiding their actual eating habits under a mountain of sheer volume.
To fix this and isolate true food culture, Mathias converted the raw numbers into internal market shares. For every country in the study, the total amount of processed tomatoes bought by households adds up to exactly 100%.
This means that when you see a percentage in the profiles below, it represents the share of that specific product within the country’s own total tomato basket. A high percentage doesn’t mean a country buys the most tomatoes globally in total volume. Instead, it shows how heavily that specific country relies on a particular product format for its meals.
By standardizing the data this way, a country like Portugal becomes mathematically comparable to a giant like the US, allowing us to see the actual structural differences in how households cook.
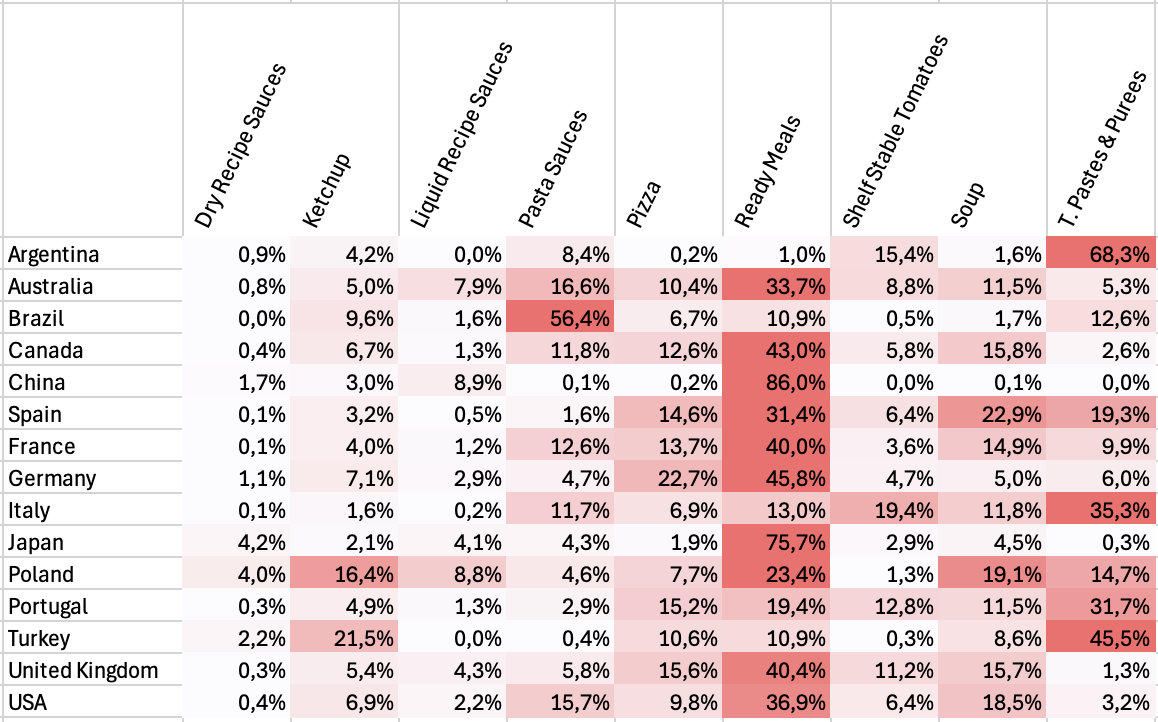
Global Breakdown of retail volume 2025 per Country and Category
The Four Cultural Families of Processed Tomatoes
While the statistical clustering of these countries is based on objective 2025 retail data, the titles and definitions of these four “profiles” are an editorial classification by Tomato News. These groupings serve as a framework to help navigate the complex global landscape, acknowledging that every market remains unique and subject to its own internal nuances
1. The Mediterranean Profile: Tomato as a Raw, Noble Ingredient
The key Countries for that profile are Italy, Portugal, and even more radically, Argentina.
Here, tomato pastes and purées rule the market with approximately half the basket as raw base ingredients. In Italy, pastes and purées make up 35.4% of retail volumes, complemented by 19.4% of shelf-stable canned tomatoes.
In Portugal, this duo accounts for over 44% of the market.
Argentina pushes this to the extreme, with tomato pastes alone grabbing a staggering 68.3.2% of retail volume.
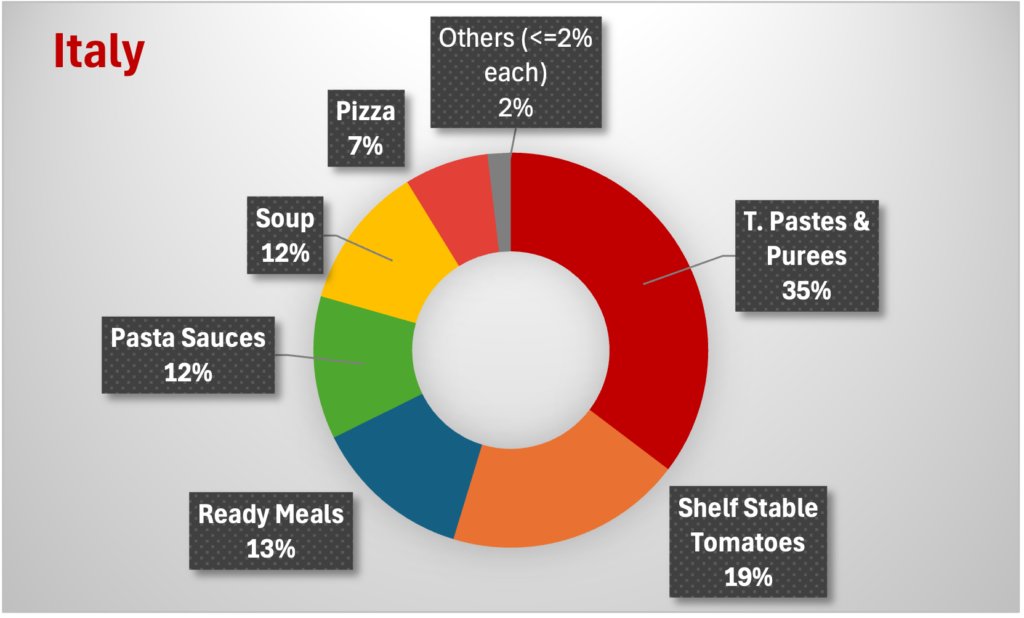
In these food cultures, processed tomato isn’t bought as a finished product. It is treated as a noble raw ingredient, purchased to be cooked, seasoned, and transformed from scratch in the family kitchen.
2. The North-Western Profile: The Era of Convenience
The key Countries for that profile are United Kingdom, Canada, France, United States, Germany.
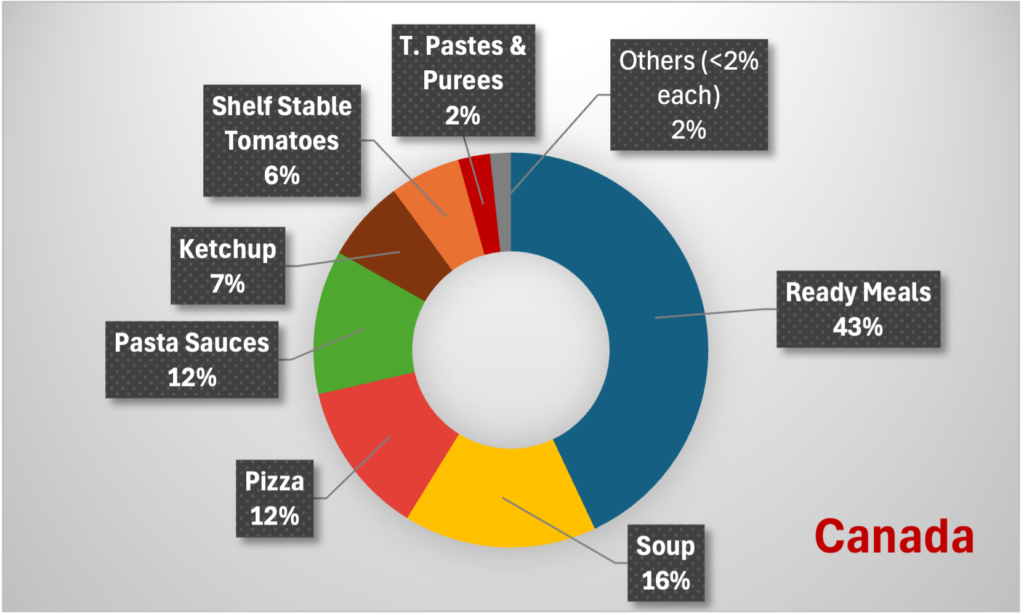
In these markets, tomatoes enter households as highly convenient finished or semi-finished products. Ready meals dominate the shelf: 43% in Canada, 40.4% in the UK, and 40% in France. This profile is also marked by a high love for tomato-based soups (in average 15% volumes) and a prominent pizza culture.
Here, tomatoes equal convenience and time-saving, perfectly matching the fast-paced demands of modern Western lifestyles.
3. The Asian Profile: Tomatoes as a Flavor Base
The key Countries for that profile are China, Japan.
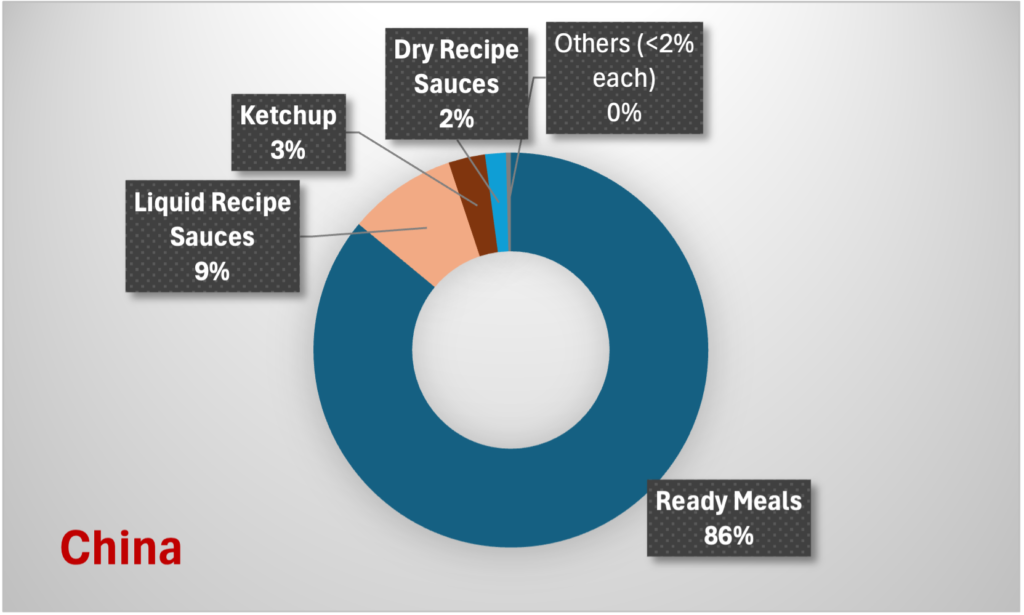
China shows a massive 86% share in ready-to-use bases, while Japan stands at 75.7%. The true signature of this profile, however, is the reliance on liquid and dry recipe sauces.
Unlike in Southern Europe, the tomato is rarely the star of the plate in Asia. It functions as a flavor enhancer, a subtle savory background note, or a cooking sauce to glaze meats, stir-fries, and noodles.
4. The Condiment Profile: The Sweet Ketchup Civilization
The key Countries for that profile are Turkey, Poland.
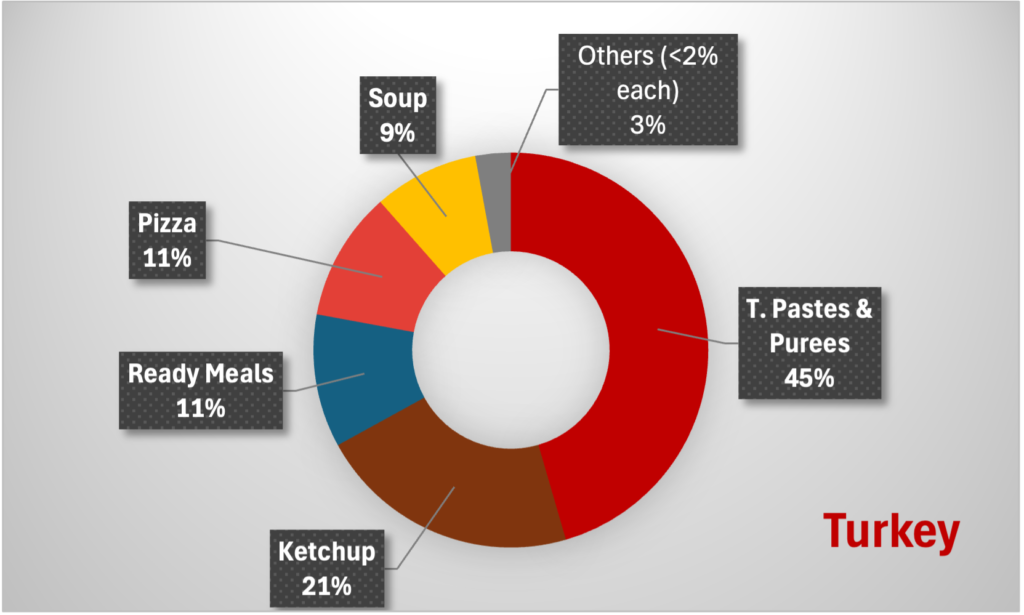
The defining metric here is the uniquely high share given to ketchup. In Turkey, ketchup accounts for a substantial 21.5% of all processed tomato purchases, while Poland maintains a high share at 16.4%.
In these regions, the tomato has earned a distinct status as a sweet table condiment. However, the data reveals a striking culinary duality, particularly in Turkey: it is the only market that pairs an aggressive “ketchup culture” with a massive reliance on raw tomato paste (45.5%). This suggests the tomato is used simultaneously as a foundational cooking staple and a finished table sauce. Poland follows a different path; while it shares the high ketchup intensity, its basket is more fragmented, spreading the remaining share across a diverse mix of tomato pastes, ready meals, and soups.
Outliers and Hybrids: Beautiful Anomalies
- Spain, the Cultural Bridge and Tourism Hub: Spain refuses to pick a side. The statistical data reliably maps it right at the intersection of Mediterranean tradition and North-Western convenience. Spanish households buy 31.4% ready meals and 22.9% soups, yet they hold onto a solid 19.3% base of tomato paste for scratch cooking.
Beyond domestic culture, Spain’s massive, world-leading tourism industry likely plays a hidden role here. The constant, massive influx of international tourists heavily influences retail availability and shapes a highly diversified food market, blending fast convenience for transient populations with traditional local culinary staples.
- Brazil, the Pasta Sauce UFO and Immigration Legacy: The Brazilian market completely defies global patterns. Its retail structure is overwhelmingly dominated by a single category: pasta sauces, sitting at a colossal 56.4%. To put this in perspective, no other country in the study exceeds 17% in this category.
This absolute anomaly might be deeply linked to Brazil’s history. The country is home to one of the largest Italian diaspora populations in the world, the result of massive waves of immigration in the late 19th and early 20th centuries. This historical heritage permanently wove pasta and tomato-based sauces into the daily DNA of the Brazilian household, creating a unique standalone market that dwarfs all conventional regional benchmarks.
- Australia & Germany, the Cosmopolitan Blends: These two markets feature highly diffused profiles with no single dominant category. Australia, for instance, showcases a balanced mix of 33.7% ready meals, 16.6% pasta sauces, and 11.5% soups. This statistical variance beautifully mirrors reality: highly diverse food cultures shaped by continuous waves of multicultural immigration, bringing together Mediterranean, Anglo-Saxon, and Asian culinary habits under one roof.
The mathematical map of global consumption
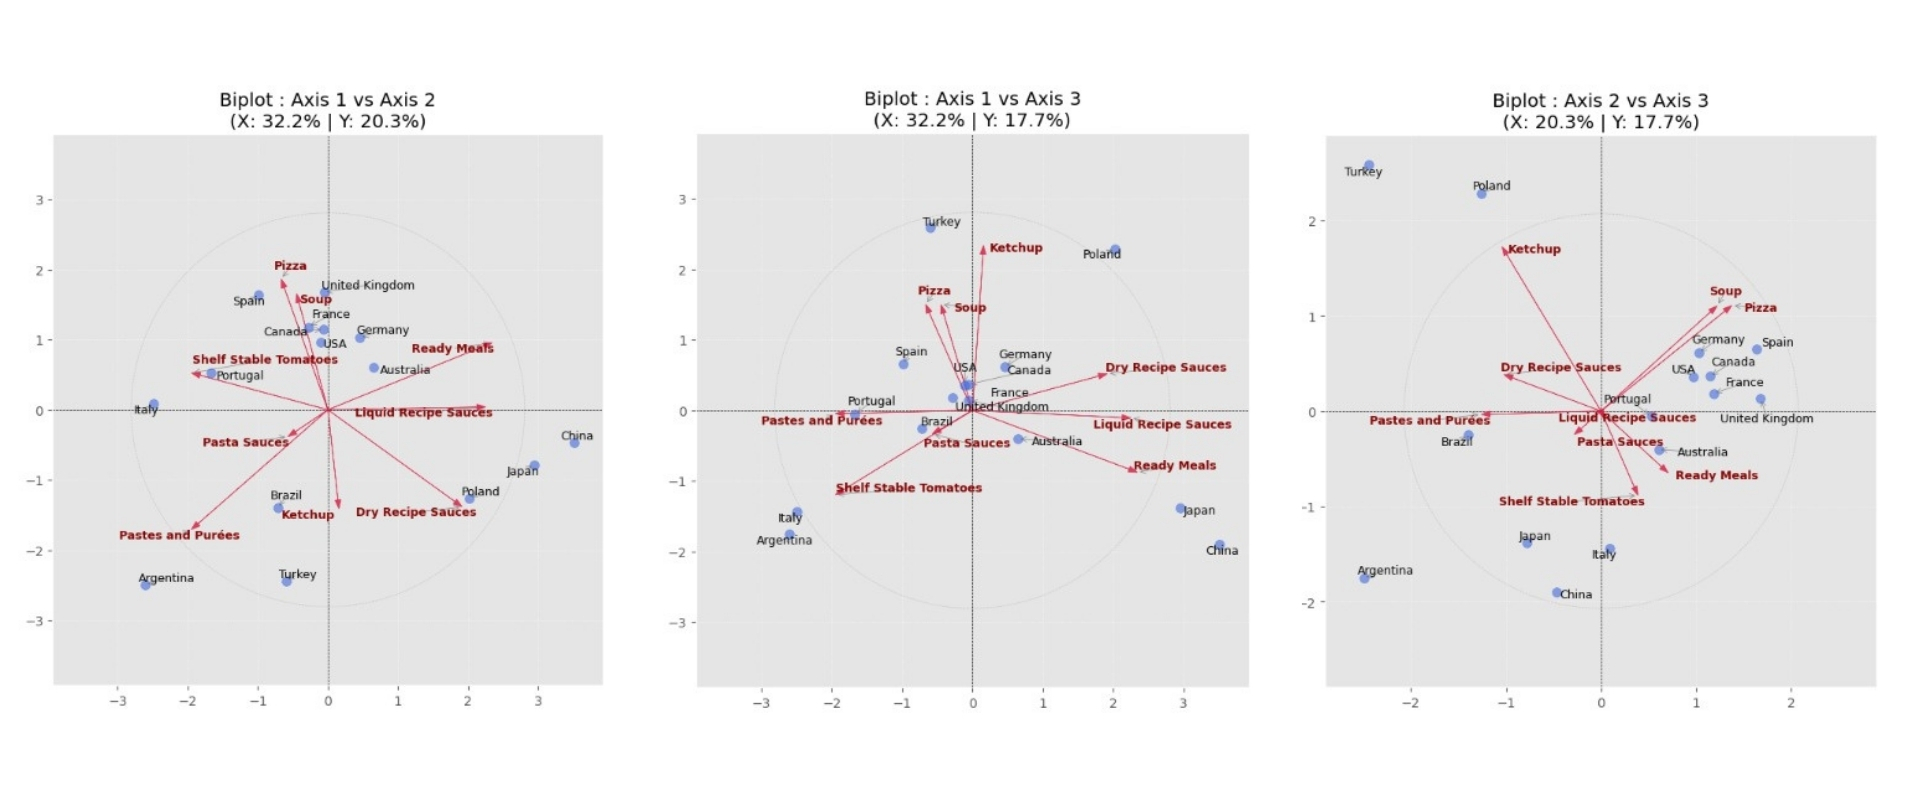
To visualize how these profiles are formed, we can look at the market’s “hidden geography.” By combining the Variable Correlation Circle (which products move together) and the Country PCA Map (how countries cluster), we can see the data in action.
Biplots: Country maps & Correlation circles
- The Products: Arrows show the direction of specific categories. For example, “Tomato Pastes” and “Ready Meals” point in opposite directions, showing a clear structural divide between traditional cooking and industrial convenience.
- The Countries: Each dot is a nation. Their position is determined by these product “pulls.” For instance, Italy and Argentina are clustered near the raw ingredients, while the UK and Canada gravitate toward the convenience side.
This dual mapping confirms that our four “families” are statistically proven clusters that define the global landscape in 2025.
Conclusion: The Bottom Line for the Industry
The data confirms a reality that every player in the industry must eventually face: global retail markets for processed tomatoes are deeply entrenched. These cooking habits aren’t just consumer trends; they are cultural legacies that evolve at a glacial pace.
For the industry, this means that success depends less on trying to reshape how the world eats and more on accurately reading the map we’ve uncovered. A product designed for a convenience-driven market will naturally struggle in a region where the tomato is still treated as a noble raw ingredient to be transformed from scratch. Ultimately, the most effective commercial strategies are those that stop trying to force short-term shifts in behavior and instead choose to align with the long-standing culinary DNA of each specific market.
Appendix: Methodological Focus
Data “Purification”: Filtering Out the Noise
To ensure the algorithm measured genuine food culture rather than market artifacts, Mathias applied five strict data-cleaning filters to the raw data:
- Stomachs, Not Wallets: Relied solely on volume (tonnes) to remove distortions from inflation, purchasing power, or premium glass/can packaging pricing.
- Granular Categories: Integrated all 9 “leaf” product categories (including liquid and dry recipe sauces). Without this, the Asian flavor profile would have been completely invisible.
- Purging Regional Aggregates: Removed all geographical macro-regions (e.g., World, Western Europe) to prevent heavy statistical weights from crushing individual country signals.
- Neutralizing Size Bias: Converted raw tonnages into internal country market shares (%). This ensured Portugal’s distinct habits weren’t drowned out by the massive sheer mass of the US market.
- Scaling Equality: Applied a StandardScaler (mean 0, variance 1) to all categories. This gave niche categories (like dry recipe sauces) the exact same statistical “vote” as massive categories (like tomato paste) when drawing the axes.
Statistically Validating the 2025 Model
- The 3-Axis Rule: The model selected 3 main principal components (PC1, PC2, PC3) using Kaiser’s criterion (eigenvalues > 1) and the scree plot elbow test. Together, these three dimensions explain an excellent 70.16% of the total variance across global behaviors.
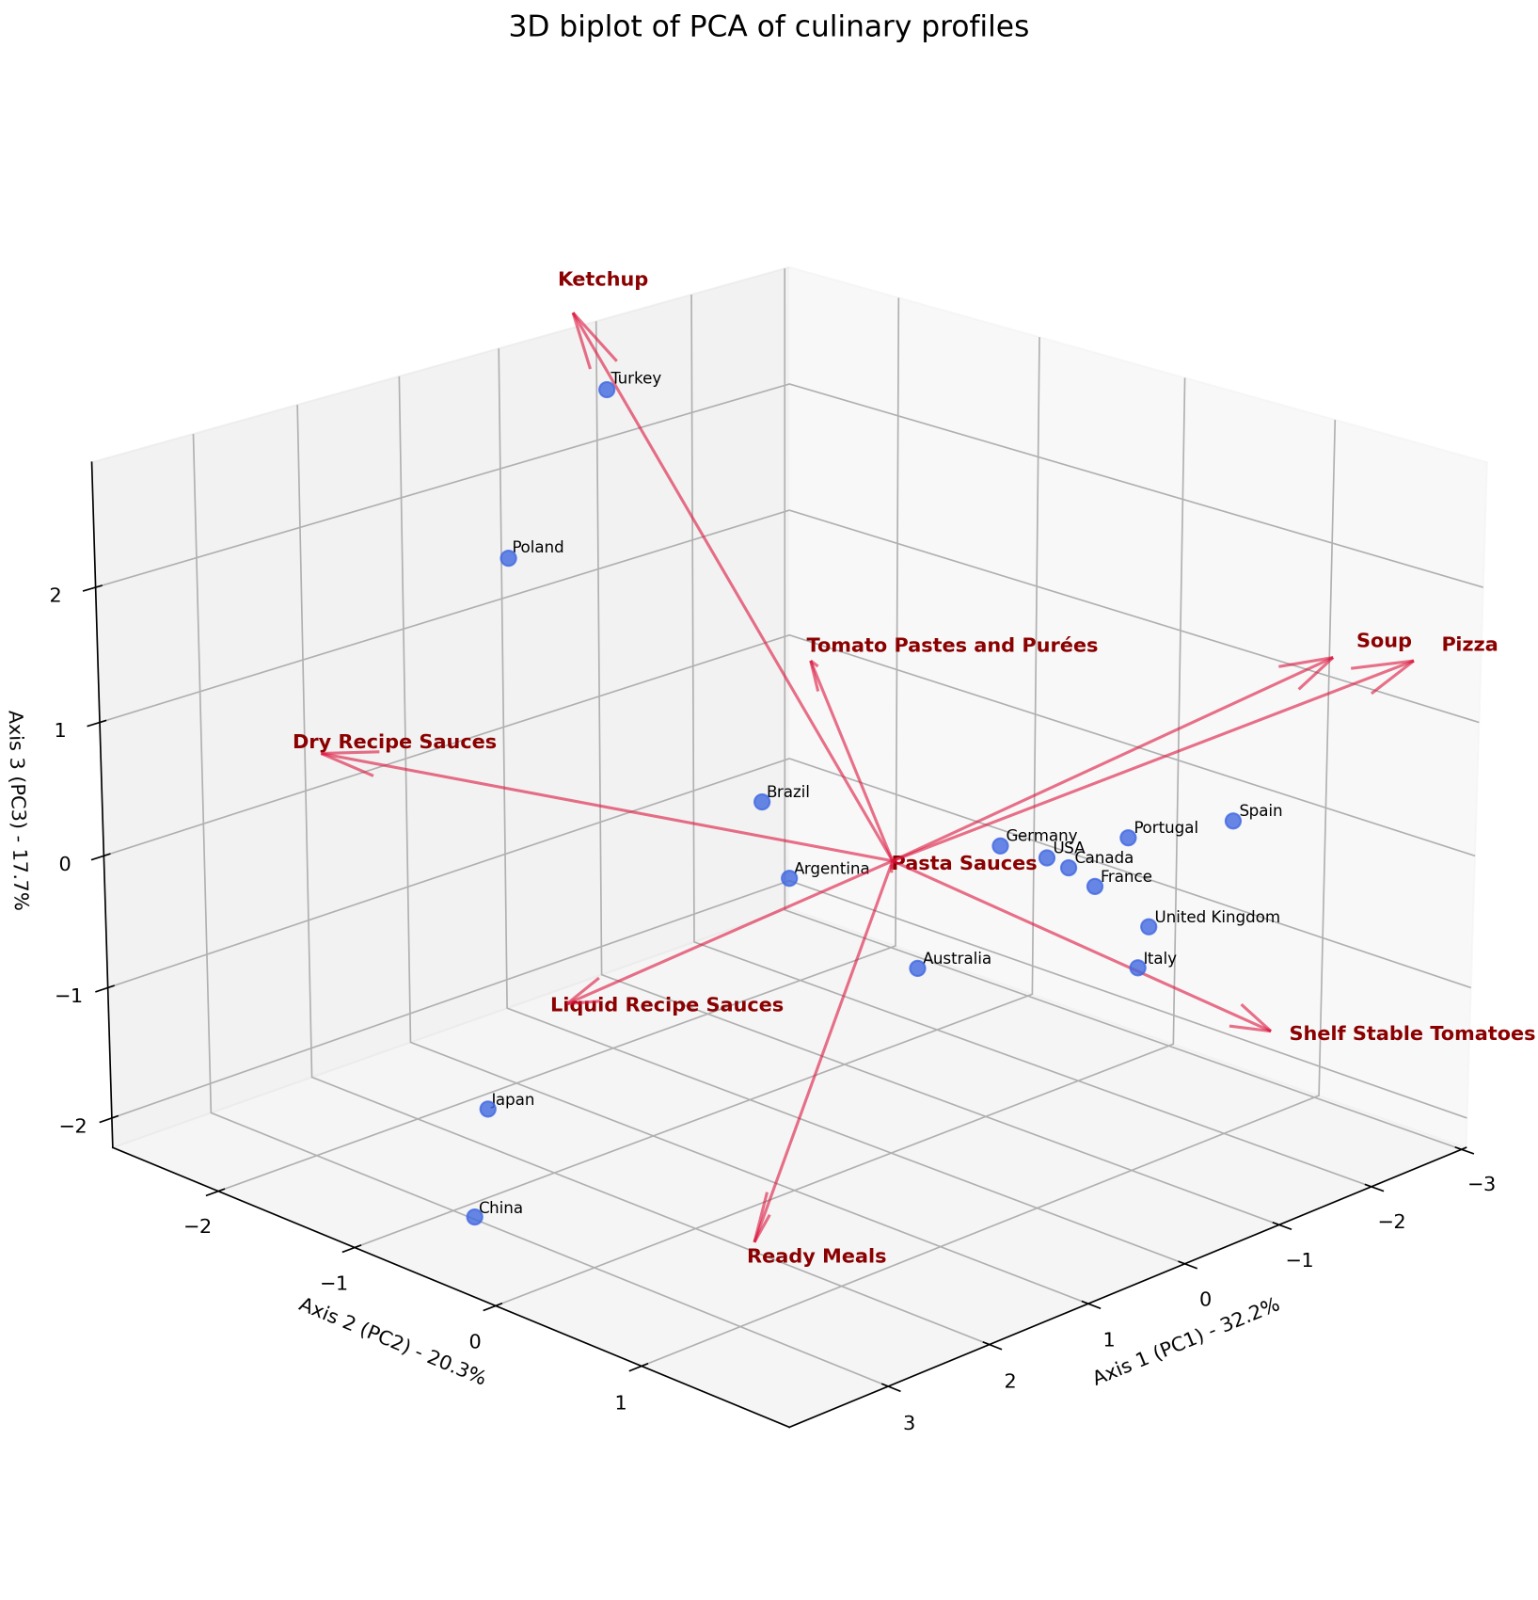
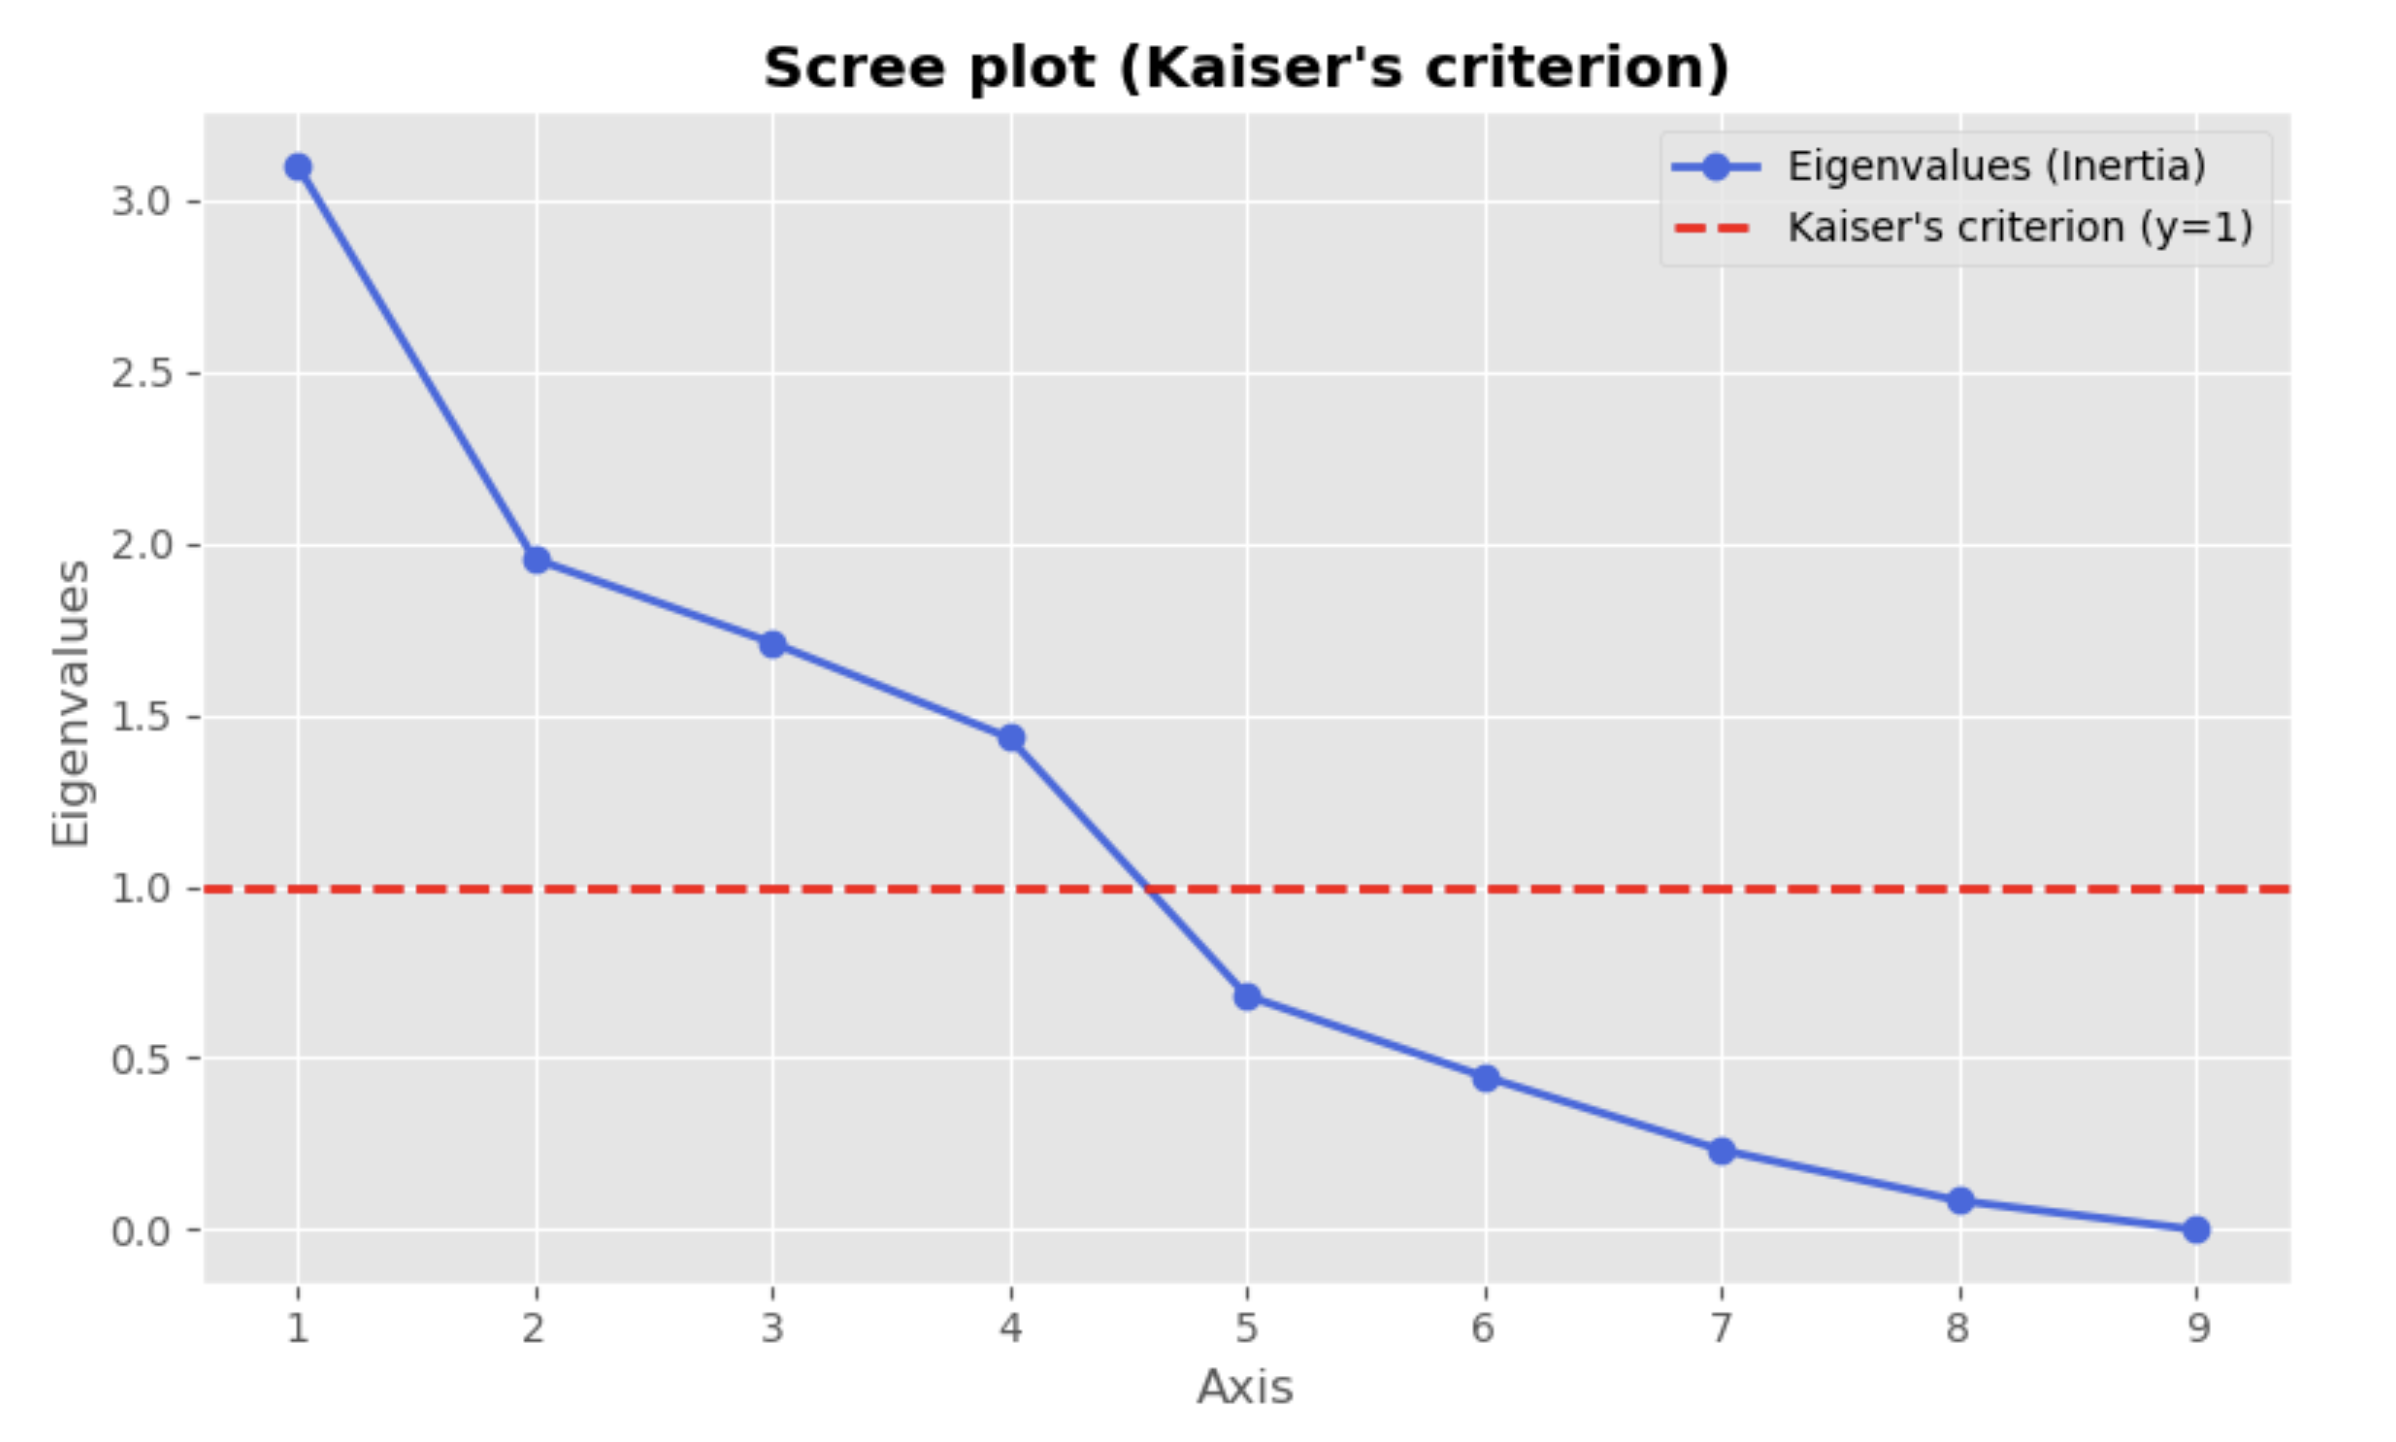
According to Kaiser’s Criterion (represented by the dashed red line), any axis with an “Eigenvalue” above 1.0 is considered statistically significant. While the data technically offers four axes that meet this threshold, we made the deliberate editorial decision to focus on the first three.
Adding a fourth dimension would have introduced a level of mathematical complexity that—while technically accurate—would have made the visual “maps” nearly impossible to interpret for a general audience. By concentrating on these top three axes, we capture the vast majority of the global market’s behavior while maintaining a clear, actionable narrative.
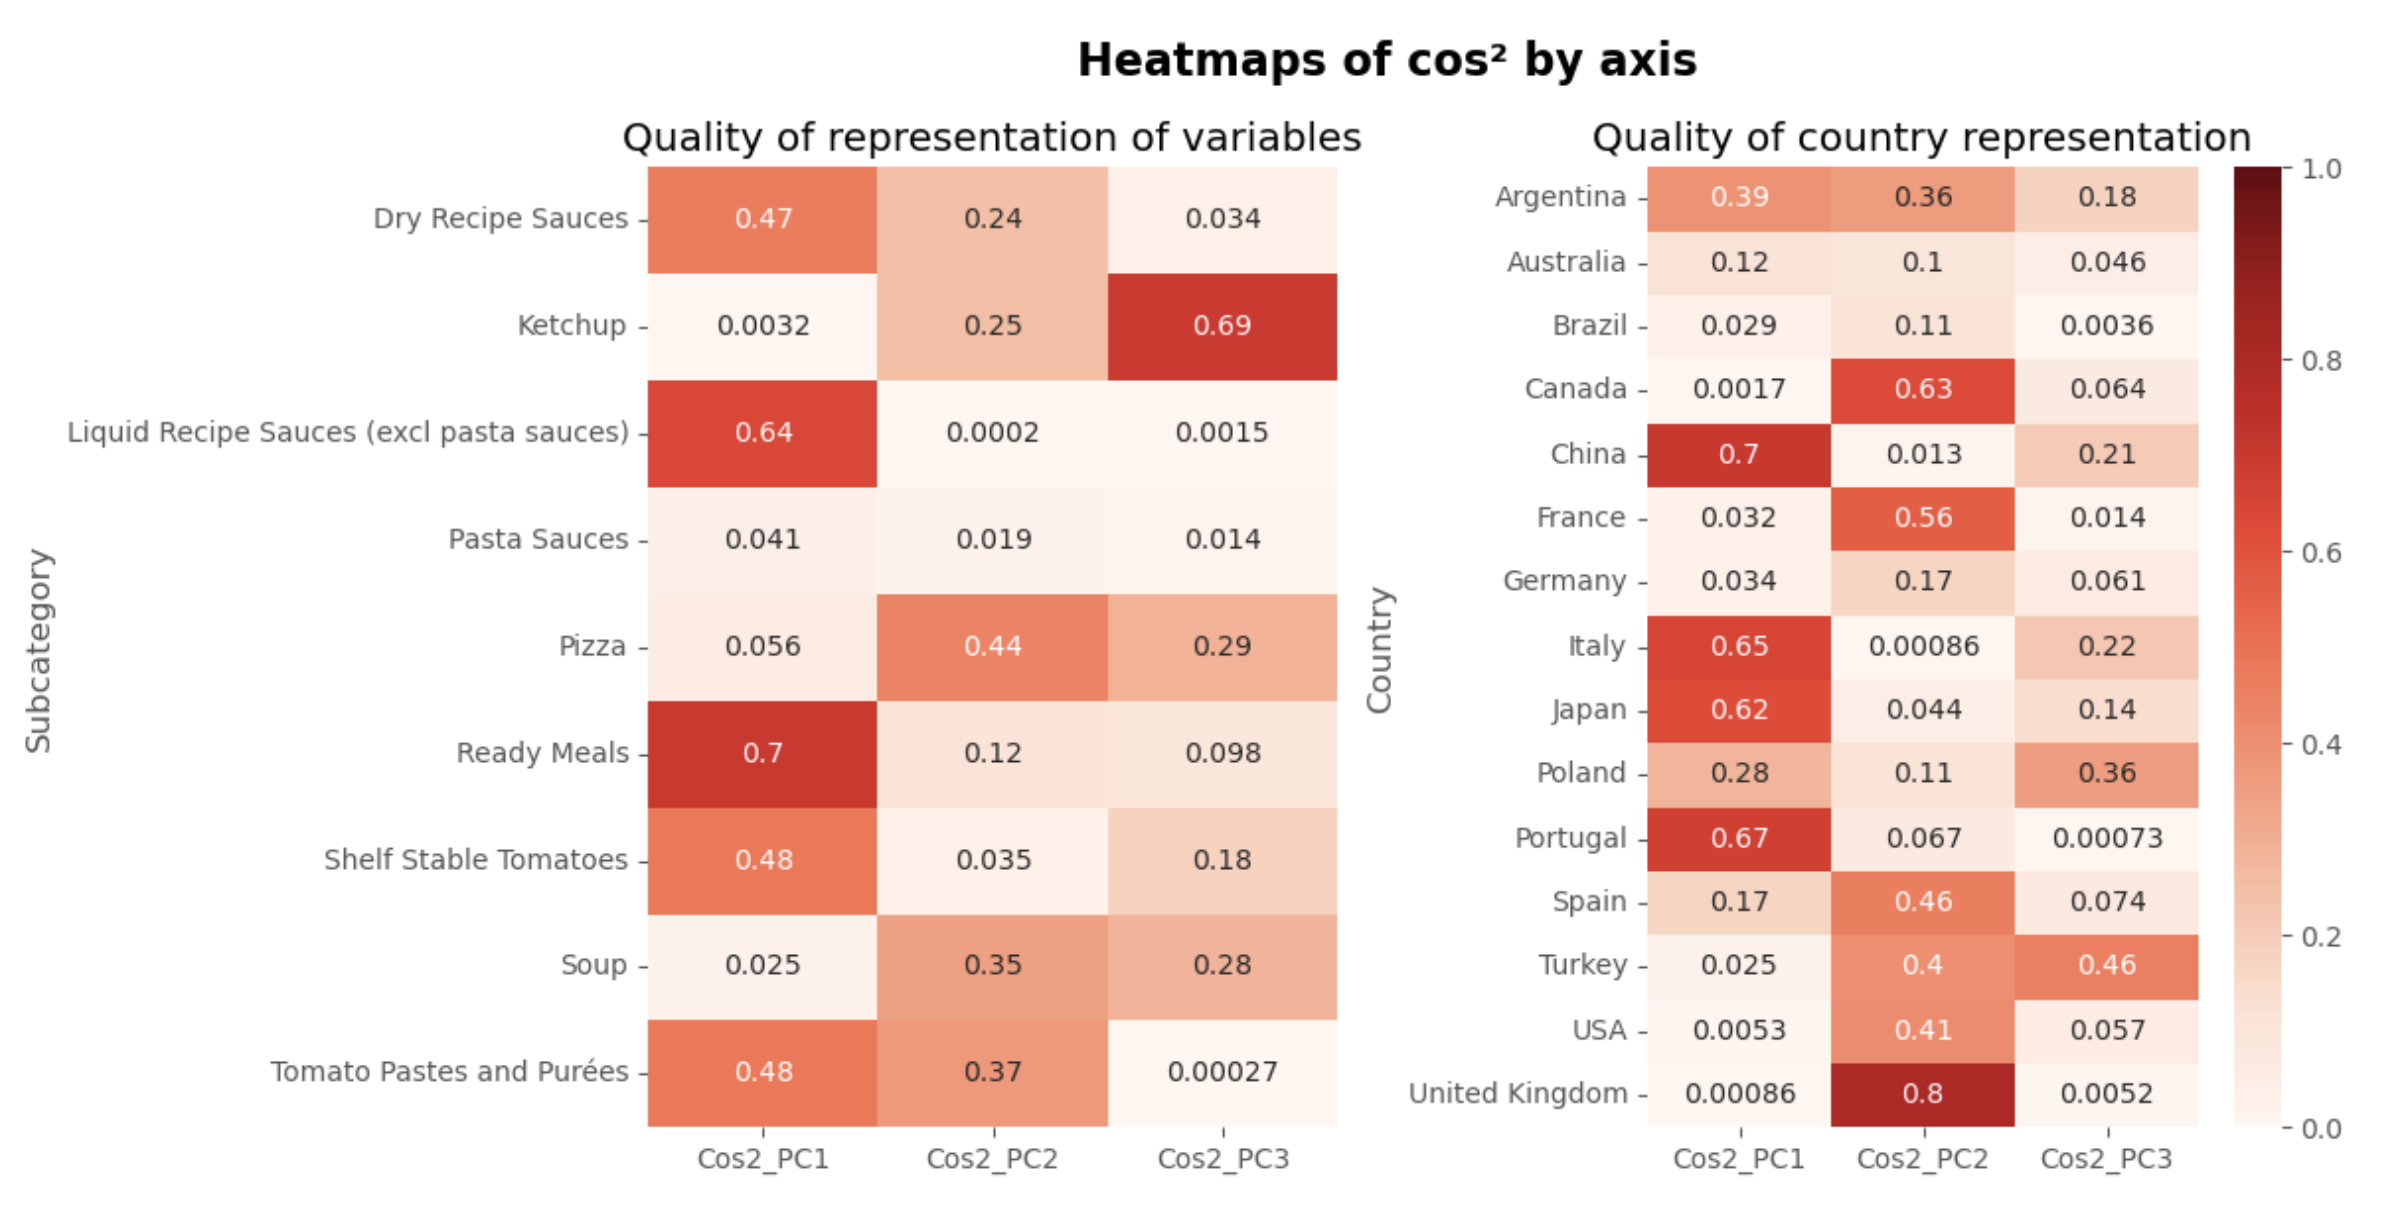
2. The Pasta Sauce Paradox: Pasta sauces showed a near-zero quality of representation (cos² = 0.079) on the main axes. This isn’t an error; it is a vital finding. Indeed, it shows the extreme case of Brazil, extremely different from all other cultures in terms of pasta sauces, as all other countries have a low score.
3. Country Confidence Index (Cos²): The country mappings are highly reliable for China (0.918), Italy (0.870), and the UK (0.806). Conversely, the math warns us that Brazil’s low score (0.145) means its visual graph position is an uninterpretable outlier, needing separate analytical models.
Sources: Data from Euromonitor Study, Statistical Research and ACP from Mathias
This is the first article based on Mathias’ PCA analyses exploring these consumer insights. Stay tuned for more deep dives over the coming weeks!