News
Quantities remain higher than in the pre-Covid period, but the pace of growth driven by the pandemic is tending to slow down.
Based on the declarations of exporting companies to the customs authorities of the main countries operating in the global tomato paste market (HS codes 200290…), the result of the July 2021/June 2022 marketing year for the TOP10 countries of the sector was 2.8% lower in volume than in 2021, but up by 3.7% compared to the pre-Covid period (2016/2017, 2017/2018 and 2018/2019).
This result is in line with the overall activity results commented on in a previous article in October 2022, which showed a decline in overall trade of just under 3% compared to the previous year and mobilized quantities more than 5% higher than those used before the surge in consumption and trade in spring 2020.
Accumulated foreign sales of the TOP10 countries in 2021/2022 amounted to just under 3.215 million metric tonnes (mT) of finished products. The details of the information provided to customs services in terms of quality categories (soluble solids content) make it possible to estimate at 17.9 million mT the quantities of tomato "raw materials" absorbed in the foreign trade of the ten leading countries over this marketing year. In the same way, the quantities of fresh tomatoes absorbed by the worldwide trade in industrially processed tomato products can be estimated at 19.6 million mT, which places the proportional share of the TOP10 countries between 91 and 92% of world trade as a whole.
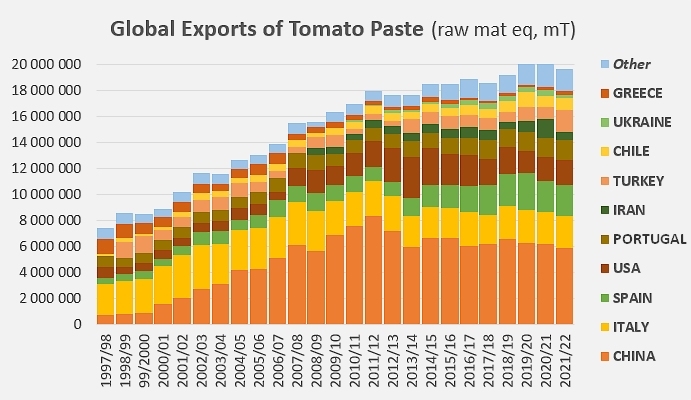
TOP10: China, Italy, Spain, USA, Portugal, Iran, Turkey, Chile, Ukraine, Greece
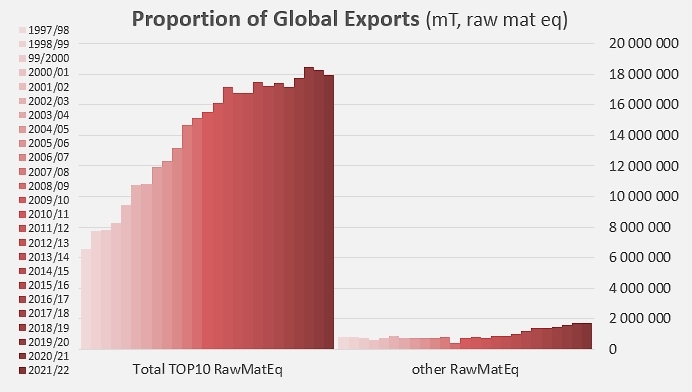
Beyond the issue of volume, the data provided in terms of quantities and qualities exported by the companies operating in exporting countries in general shows a clear contrast between the dynamics of the TOP10 countries and those of other countries operating in the sector. So between the last two marketing years (2020/2021 and 2021/2022) the decline in foreign sales of finished products was more marked for "other countries" (-3.5%) than for the TOP10 (-2.8%). Conversely, the progression of export performance between the pre-Covid period and the last marketing year was much slower for the TOP10 as a whole (3.7%) than for the "other countries" (20%)
This difference undoubtedly explains in part the gradual loss of influence of the TOP10 in the global context of paste exports between the period preceding the pandemic and the last marketing year. Despite the approximations inherent in the way the information is collected through declaration and the imperfections of the customs nomenclature, it can be estimated that the quantities exported by the TOP10 represented only about 91% of world trade in 2021/2022, a clear decline compared to the 92.5% recorded over the 2016-2019 period. This decline has occurred independently of the Covid crisis, since the momentum seems to have started a few years earlier, around the 2011/2012 marketing year, at a time when TOP10 exports, at their peak, accounted for just over 96% of global supplies.
This difference undoubtedly explains in part the gradual loss of influence of the TOP10 in the global context of paste exports between the period preceding the pandemic and the last marketing year. Despite the approximations inherent in the way the information is collected through declaration and the imperfections of the customs nomenclature, it can be estimated that the quantities exported by the TOP10 represented only about 91% of world trade in 2021/2022, a clear decline compared to the 92.5% recorded over the 2016-2019 period. This decline has occurred independently of the Covid crisis, since the momentum seems to have started a few years earlier, around the 2011/2012 marketing year, at a time when TOP10 exports, at their peak, accounted for just over 96% of global supplies.
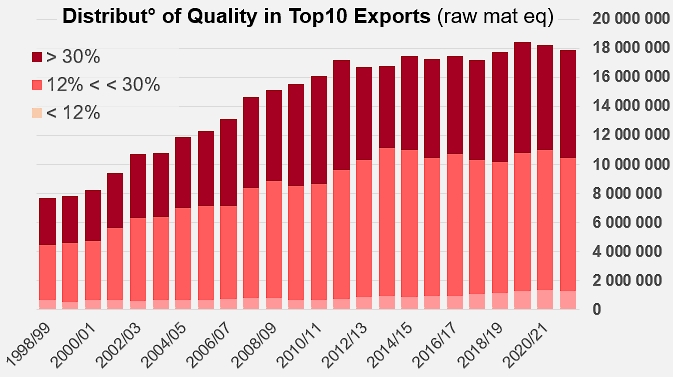
In addition, the decrease in the tonnage recorded seems to have been accompanied by a growing customer demand for finished products that are technically more efficient but have a lower soluble solids content. This shift has resulted in a slight decrease in the overall average soluble solids content of exported products, which has also contributed to a modest extent to the erosion of the preponderance of TOP10 countries, since at the same time the products exported by "other countries" seem to have been affected very little – if at all – by this change in demand.
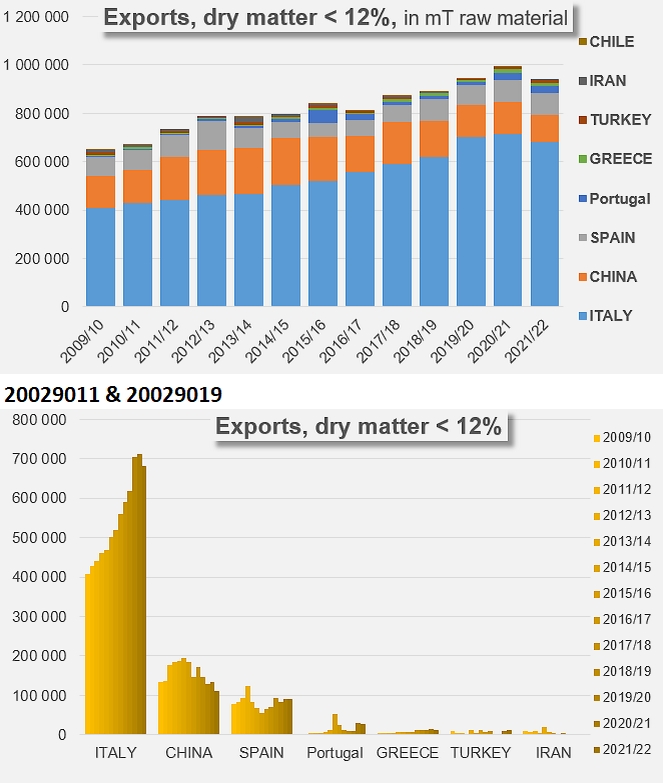
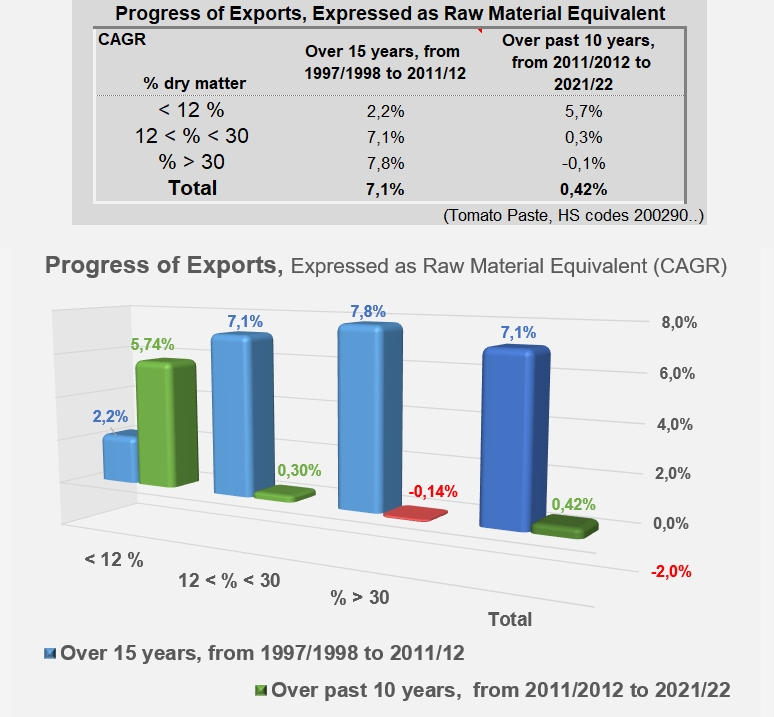
Unlike what the sector experienced until the first decade of the 2000s, the current pattern of demand is no longer generating rapid growth in the volumes traded, nor is it mobilizing large processing capacities or surface areas for cultivation. For the past ten years, apart from the exceptional episode linked to the pandemic, growth in volume has only been driven by the development of "low concentration" products (codes 20029011 and 19). The sluggish growth observed from 2011/12 onwards, in particular for the TOP10 countries as a whole, is based on an annual rate of around 0.4% over the last ten years, whereas before that date exports were growing at a rate of around 7%.
In a detailed breakdown, the annual rate of about 7 to 8% that drove exports of products under codes 20029031, 39, 91 and 99 of TOP10 countries between 1997/98 and 2011/2012 has fallen sharply and is now between -0.1% and 0.3%. At the same time, the growth of exports of products under codes 20029011 and 19, close to 2% before 2011/12, has increased significantly and has now been close on 6% for the last ten years (see additional information at the end of this article).
Without saying that results are leveling off, it must be noted that the quantities of raw tomatoes absorbed by the cumulative exports of TOP10 countries have only increased by a little more than 730,000 mT since 2011/12, whereas they had increased by nearly 10.6 million mT over the previous fifteen years.
The Italian sector is the main driving force behind the growth in exports of "low concentration" products (codes 2002111 and 20029019), occupying around 72% of the category, with only two significant competing industries, China (12%) and Spain (10%).
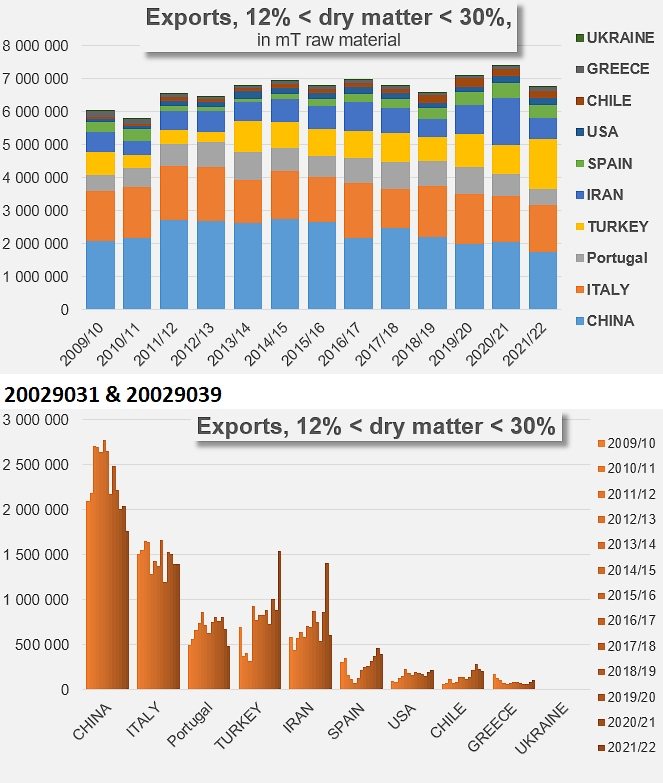
The category of products with 12 to 30% soluble solids (codes 20029031 and 20029039) is more divided, with the preponderance of Chinese products (26% of the market in 2021/22) being increasingly challenged by Italian products (20%), and also more recently by Turkish products (22% of the market in 2021/22). Other national industries, notably Portuguese and Iranian and, to a lesser extent, Spanish, US, Chilean, etc. share the remaining 30% of this category.
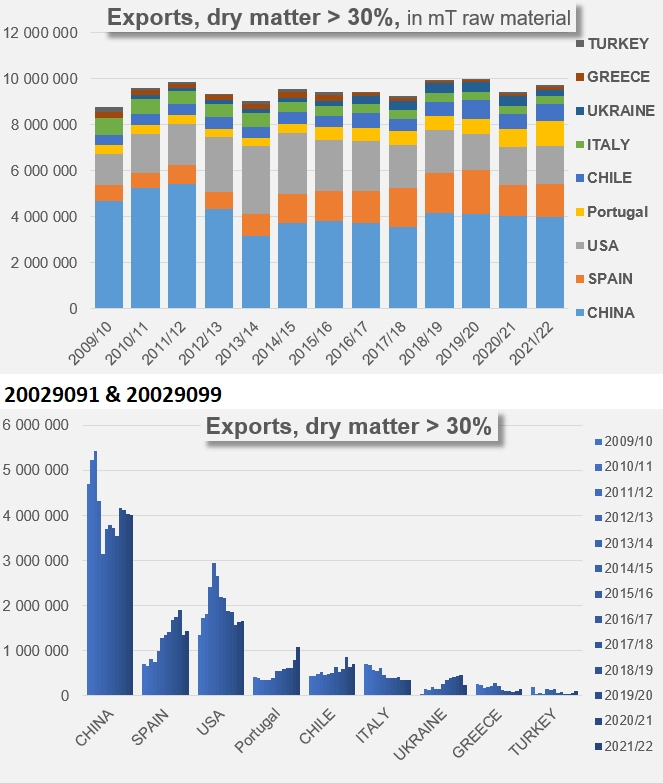
The high concentration products found on the market are mostly Chinese (41% in 2021/22) and to a lesser extent, US (17%), Spanish (15%), Portuguese (11%) and Chilean (7%).
Some complementary data
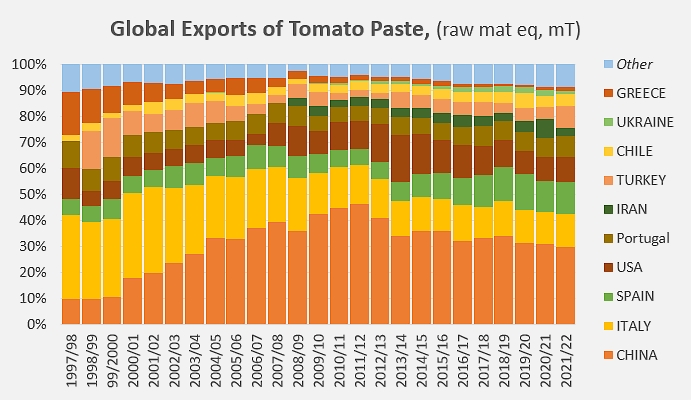
Contribution of each of the TOP10 countries to the cumulative total of exports, over the last twenty-five marketing years.
Contribution of each of the TOP10 countries to the cumulative total of exports, over the last twenty-five marketing years.
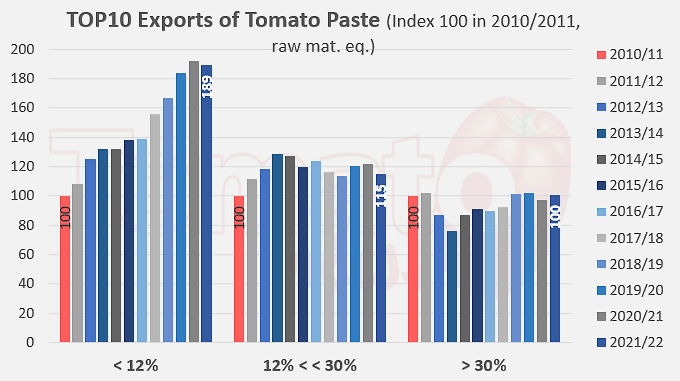
Evolution of exports of tomato pastes (codes 200290..)from all TOP10 countries (index 100 in 2010/2011), according to product category (soluble solids content).
Comparison of the growth rates (compound annual growth rate) of tomato paste exports (codes 200290..) expressed in raw material equivalent, from 1997/98 to 2011/12 and from 2011/12 to 2021/22.
Source: Trade Data Monitor


