News
Global Processed Tomato Market: Foodservice vs. Retail Distribution – Part 1
This report presents a strategic analysis of the global processed tomato market, structured around the intersecting dynamics between retail channels and the foodservice sector. Through a PCA statistical modeling of the Euromonitor international panel, combined with a dimensional market analysis, this study decodes current balances by product and region, while outlining prospects up to 2030. These data highlight a historic shift in dynamics, where the foodservice sector is emerging as the primary growth driver for the coming years, contrasting with a mature domestic market.
Part One: Principal Component Analysis of Foodservice 2025
The study of Foodservice market shares in 2025 reveals major structural disparities across the world, which Principal Component Analysis (PCA) models with precision. By cross-referencing data from 15 countries and 9 types of industrial tomato derivatives, this statistical approach highlights four distinct market profiles, shaped by local culinary cultures, the boom in delivery services, and the influence of restaurant chains.
Four clusters
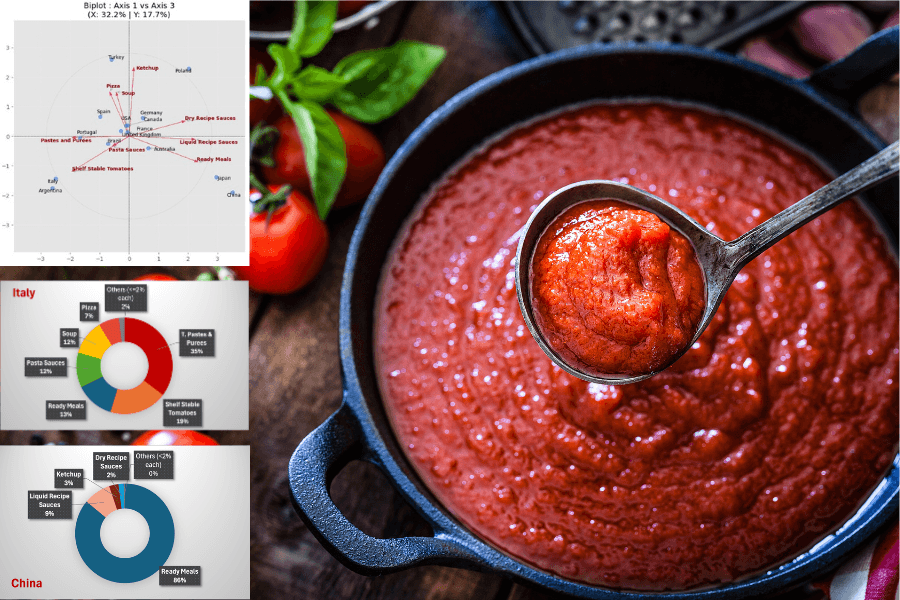
The statistical study (PCA) explains nearly 65% of the observed differences based on two major factors: the overall intensity of Foodservice reliance on one hand, and the contrast between certain product types (pasta sauces and liquid sauces versus soups and tomato paste) on the other. The analysis made it possible to group these countries into four distinct profiles (clusters).
- The North American champions (Canada, United States): an omnipresent and ultra-developed foodservice sector
Driven by an extremely powerful foodservice sector and fast-food chains, Canada and the United States form a group of their own. Here, Foodservice is king: foodservice market shares exceed 50% across five different product categories. Canada holds the absolute record of the panel for tomato paste, with 77.2% of market shares captured by Foodservice, and also dominates in soups (58.7%). The United States boasts a world record for canned tomatoes at 71.7%, and stands out with a 50.5% market share held by Foodservice for dehydrated sauces.
- China’s unique profile: a massive transition toward Foodservice
China represents a unique case globally. Foodservice is omnipresent there, even in categories that, everywhere else (especially in Europe), remain the domain of home cooking. This phenomenon is explained by the explosion of restaurant chains and delivery services. China records extraordinary and unparalleled rates: 69.5% of market shares captured by Foodservice for liquid sauces, 62.3% for pasta sauces, and 62.2% for ketchup.
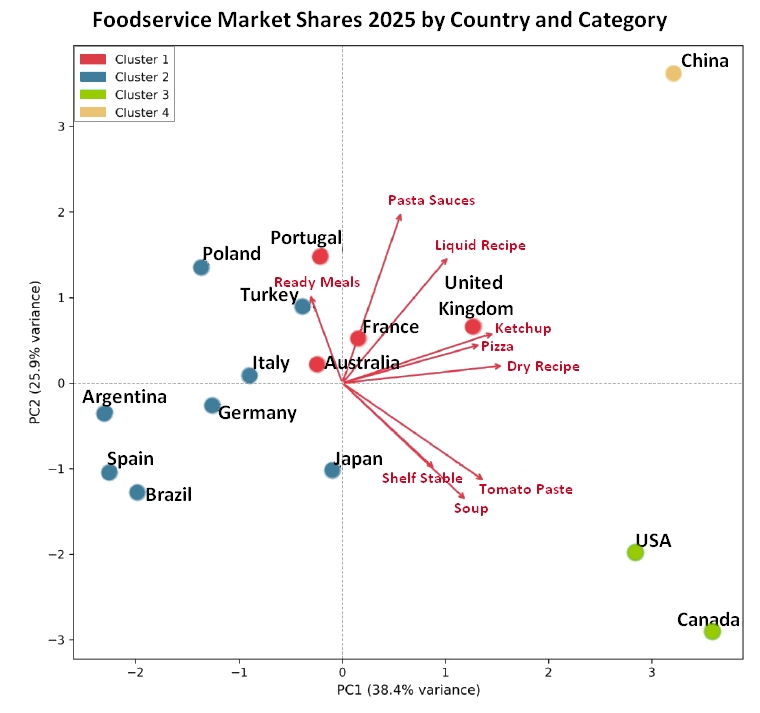
PCA biplot. Red arrows: variables (categories).Colored points: countries, color-coded by cluster.
- Intermediate markets: a mature balance between foodservice and home consumption
These four countries (Australia, France, Portugal, United Kingdom) display a certain maturity, with moderate to high Foodservice market shares in convenient and accompaniment products. On the other hand, consumers continue to prefer supermarket purchases (Retail) for ready meals or pasta sauces. France pulls the group upward with a 65% Foodservice share for dehydrated sauces (the highest score in the group) and 52.8% for canned tomatoes (peeled, unpeeled, diced, etc.). In the United Kingdom, Foodservice is particularly robust in dehydrated sauces (59.5%) and tomato paste (43.9%).
- Retail-dominated markets: home cooking remains the rule
This is the largest group, comprising eight countries (Argentina, Brazil, Germany, Italy, Japan, Poland, Spain, Turkey) spread across four continents. In these countries, the penetration of out-of-home dining is marginal across nearly all processed tomato categories. Ketchup is the only product that stands out in Foodservice, exceeding a 33% market share on average. It is also worth noting that despite their strong culinary cultures, Italy and Germany remain heavily oriented toward home consumption. Turkey outperforms the rest of its group in ketchup (55.5%) and tomato paste (43.5%). From Poland to Brazil, a wide gap is observed in the ready meals category; Poland posts the highest Foodservice share in the study (24.7%), while Brazil brings up the rear with a near-zero score (0.1%).
Examination of Foodservice shares (%) by country and by product
An examination of the heatmap provides a striking visual confirmation of the major global balances and the statistical classification into four clusters. The chart immediately highlights the stark contrast between the North American and Asian markets, saturated with warm, dark shades synonymous with high Foodservice penetration, and the vast central zone of the other cluster: this bloc of eight countries (Italy, Germany, Brazil, Argentina, Spain, Poland, Turkey, and Japan), predominantly shaded in light yellow, embodies the low contribution of the foodservice sector and the overwhelming weight of the retail distribution channel (supermarket sales) for home consumption.
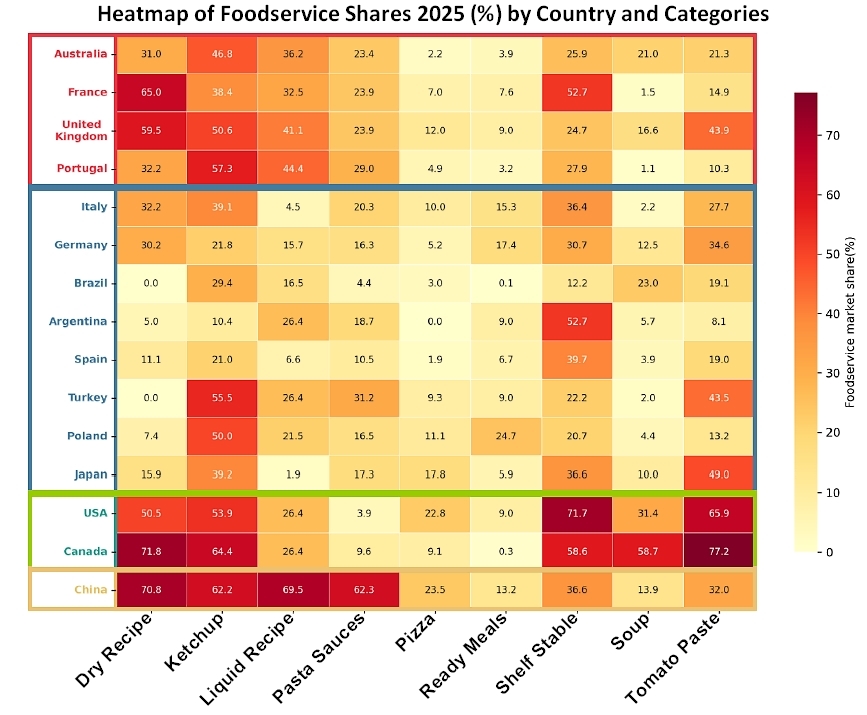
Foodservice Share Heatmap (%). Countries sorted by cluster (colored borders). Reading: the darker the cell, the higher the FS share.
- Global invariants and the prepared products paradox
On a global scale, certain product categories display near-identical behavior from one continent to another. Ketchup thus stands out as the universal product of out-of-home dining: it is the only column on the chart to feature a deep orange to bright red color across almost all fifteen countries studied. Even within the retail-dominated cluster, ketchup remains a pillar of Foodservice, as evidenced by the scores of Turkey (55.5%) or Poland (50.0%).
Conversely, the pizza and ready meals categories appear to be the poor relations of commercial foodservice. Shown almost entirely in yellow across the entire map, these columns indicate that for these segments, tomato processors sell massively to supermarkets. In foodservice, either these dishes are prepared from raw raw materials, or they bypass traditional supply chains for processed tomatoes.
- Focus on atypical profiles and trend disruptions
It is by observing horizontal color disruptions that one grasps the full complexity of these markets in 2025. The case of China is, in this regard, the most spectacular. While the liquid sauces and pasta sauces columns are generally light in the rest of the world—signaling that Western consumers buy their sauce in cartons at the supermarket—they are colored dark red in China, with respective rates of 69.5% and 62.3%. This unique profile illustrates the hyper-development of delivery platforms and restaurant chains in Chinese territory, contrasted with a weak tradition of home-cooked Western cuisine.
The North American bloc, although bound together in the same high-performance cluster, also reveals strategic nuances: the United States clearly outperforms in finished or convenience products such as canned tomatoes (with a foodservice market penetration rate of 71.7%) and ketchup (53.9%), while Canada posts absolute records for pure raw materials, capturing 77.2% of the tomato paste foodservice market and 58.7% for soups.
Finally, the heatmap helps nuance the monolithic appearance of the Retail cluster. Amid countries heavily oriented toward domestic consumption, certain anomalies appear as commercial opportunities: Argentina and Spain break their group’s dynamic by showing high Foodservice penetration in the canned tomato segment (notably 52.7% for Argentina). For its part, Japan stands out with a very pronounced use of tomato paste (49.0% ) in professional kitchens, aligning with standards close to European intermediate markets.
Cluster geometry by product type
While the heatmap allows for a detailed analysis by country, the radar presentation visually synthesizes the “surface area” occupied by out-of-home dining within each group.
The hierarchy of this market penetration is immediately apparent through the size and spread of the colored areas. One can clearly distinguish a compact structure contracted toward the center for the retail-dominated hub (Cluster 2), a targeted asymmetrical profile for intermediate markets (Cluster 1), and two massive but diametrically opposed blocs for China (Cluster 4) and North America (Cluster 3).
It is in the comparison of these two foodservice giants that the full divergence of global typological models is expressed. China’s profile expands spectacularly toward the top and right of the radar, revealing a massive orientation toward the ready-to-use sauces hub, particularly liquid sauces, pasta sauces, and ketchup. This geometry demonstrates that Chinese foodservice favors fluid and elaborate solutions, moving away from raw ingredient formats. Conversely, the North American bloc formed by Canada and the United States offers an almost totally reversed profile: its most aggressive and sharp spike stretches toward the bottom and left of the chart, nearing the 80% mark for tomato paste and canned tomatoes. This is the visual signature of a standardized Anglo-Saxon model, heavily dependent on low-processing, high-volume industrial derivatives and dehydrated sauces to supply its restaurant chains.
The two remaining profiles complete this typology with equal clarity. The intermediate markets group (Cluster 1), which includes France and the United Kingdom, draws an arrow-like shape pointing to the right, with a relatively broad and balanced footprint across the dehydrated sauces, liquid sauces, and ketchup triptych; however, the profile is marked by a sharp drop toward the center of the chart on the ready meals and pasta sauces axis, confirming that European consumers switch to supermarket channels for these culinary categories.
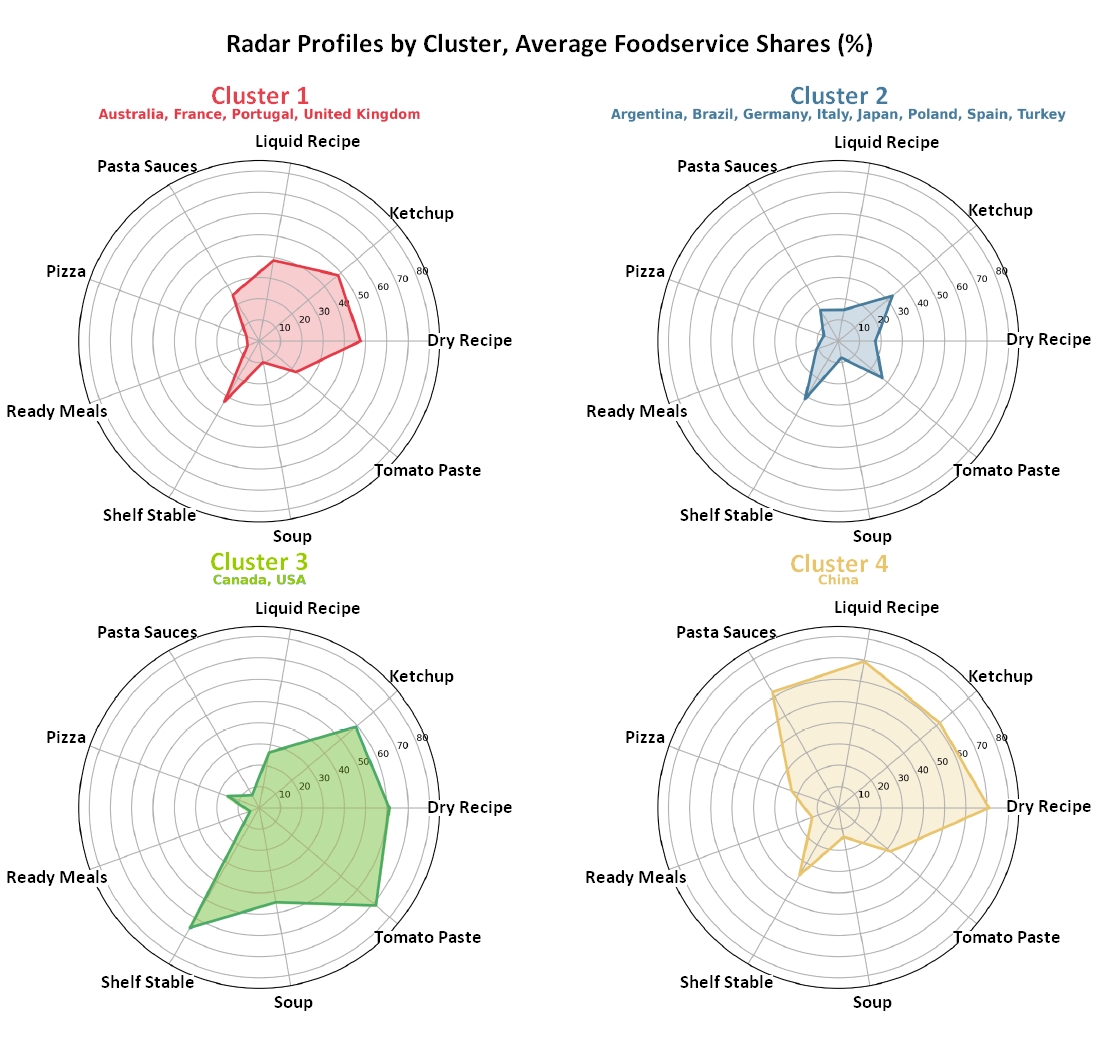
Finally, the retail-dominated group (Cluster 2) graphically expresses its nature through a small blue polygon, confined within low penetration values. For these eight countries, the surface area collapses below the 10% to 15% mark on almost all axes, with only one single exception. The only two points that manage to break out of this central core to approach the 40% line are ketchup and canned tomatoes, confirming that in these home-cooking-oriented culinary cultures, foodservice only manages to capture processed tomatoes in the form of a table condiment or an ingredient for professional preparations.
In summary, the cross-analysis of Euromonitor data shows that a market entry strategy for processed tomatoes cannot be limited to a purely geographical approach. For industry players, success actually depends on a fine understanding of the “Country x Category” pairing, since a market structurally oriented toward supermarkets can still harbor highly profitable niches for Foodservice if the right product is chosen. This is precisely what the PCA study highlights, revealing that global Foodservice is not progressing uniformly across the globe. On the contrary, its development unfolds subtler around precise seasoning niches or radically different outsourcing strategies depending on cultural zones.
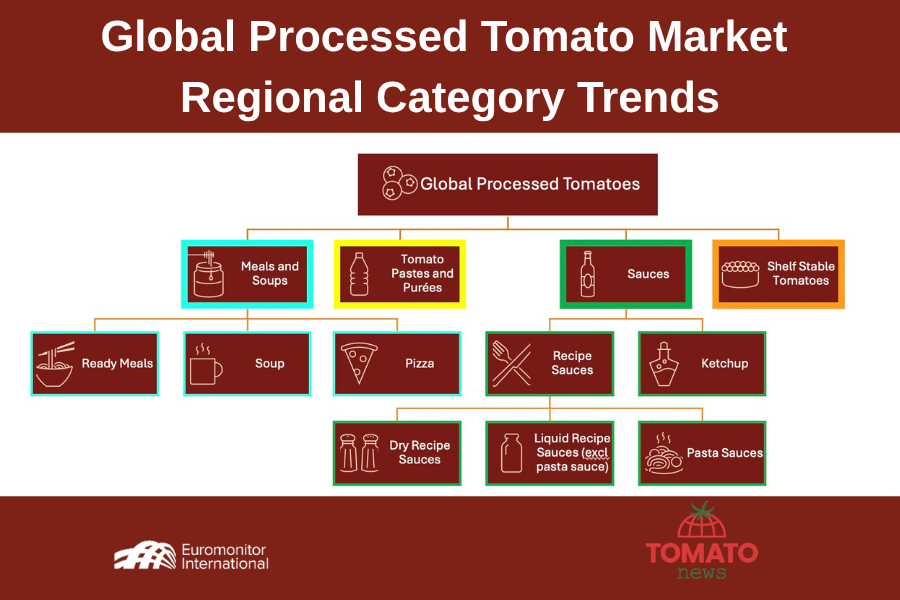
For details on the Euromonitor product categories, click here.
Source: Euromonitor


