News
Euphoria or Despair: A Look at the Historical Cycles and What the Future May Hold
Introduction by Mike Montna
Martin Stilwell was born in Lisbon, Portugal, in 1949. After obtaining his first degree in Agricultural Botany at the University of Reading (UK), he earned his PhD in Plant Breeding and Genetics at Cambridge University (UK).
He began his career in 1970 as a Tomato Breeder in the Overseas Agricultural Development Department of HJ Heinz. By 1982, he was a senior manager in Purchasing for HJ Heinz UK, followed by a period in financial planning and profit forecasting. From 1985, he served as General Manager of Operations for Idal (Heinz Portugal), before becoming Managing Director of Marie Elisabeth Foods (part of the HJ Heinz Starkist group) in 1988.
In 1992, he left the HJ Heinz group to join Boschi Luigi and Figli (Parma, Italy) as CEO of their newly formed Portuguese company, Italagro S.A. In 2007, partnering with Kagome Co., Mitsui & Co., and others, he created HIT SGPS and successfully purchased Italagro S.A. and FIT S.A. from Boschi Luigi & Figli. He is currently President of the Group. In 2013, he was also elected Executive Officer of Kagome Co. Japan.
Martin is the President of Tomato News SAS, President of the Portuguese Tomato Processors Association (AIT), and a past president of the WPTC. He is a wonderful friend to this industry. I know I always enjoy his sessions because he brings a vital historical perspective while balancing the good news with the bad. Either way, you always get the absolute truth from him. Please join me in welcoming Martin Stilwell.
“Euphoria or Despair” — Martin Stilwell
Looking to the Long-Term Horizon
Thank you. We all know things are difficult right now. What has been coming out of China these past years is shocking to me, so today we are going to follow the journey of a fictional tomato salesman I call ‘Jack’ through the coming seasons.
I’m being brave today. For the first time, I won’t just look at the immediate future; instead, I want to project our outlook all the way out to 2030 and 2032.
2024: The Phase of Euphoria
If we look back at 2024, it was pure euphoria. In the slides, Jack has his umbrella up, riding high.
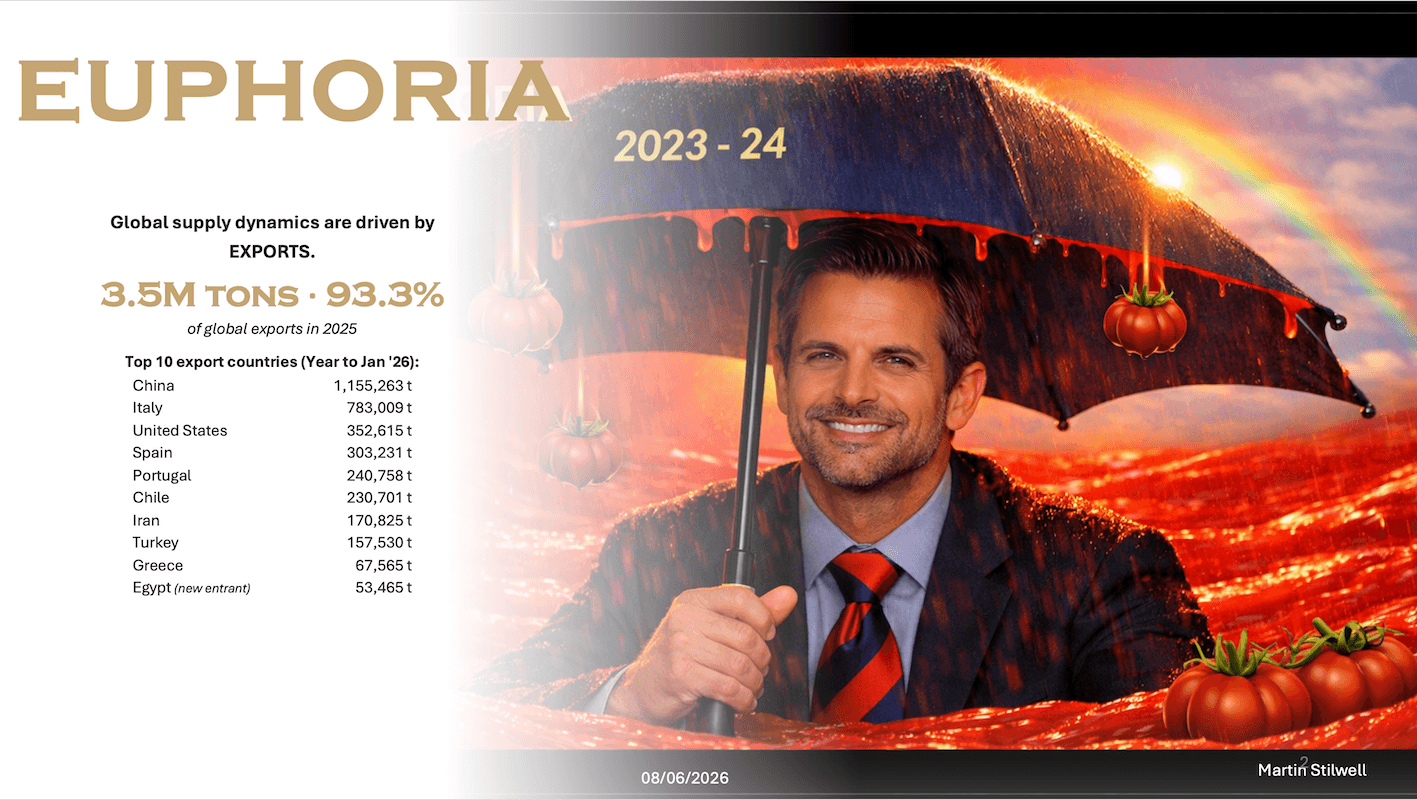
Our market is essentially run by exports. Local, domestic markets are inherently much more stable than export markets. The global export market is heavily dominated by the ten largest players: China, Italy, the US, Spain, Portugal, Chile, Iran, Turkey, and more recently, Egypt. The sheer quantities involved—particularly from China—are huge.
These upcoming graphs are quite interesting because I’ve analyzed the last 20 years of data. Many of you knew our great friend Duncan Blake. Duncan and I used to argue endlessly about numbers. He always maintained that if you look at a long enough period, the exact accuracy of the individual numbers matters less than your ability to pick up the overall trend. I have tried to apply that logic today.
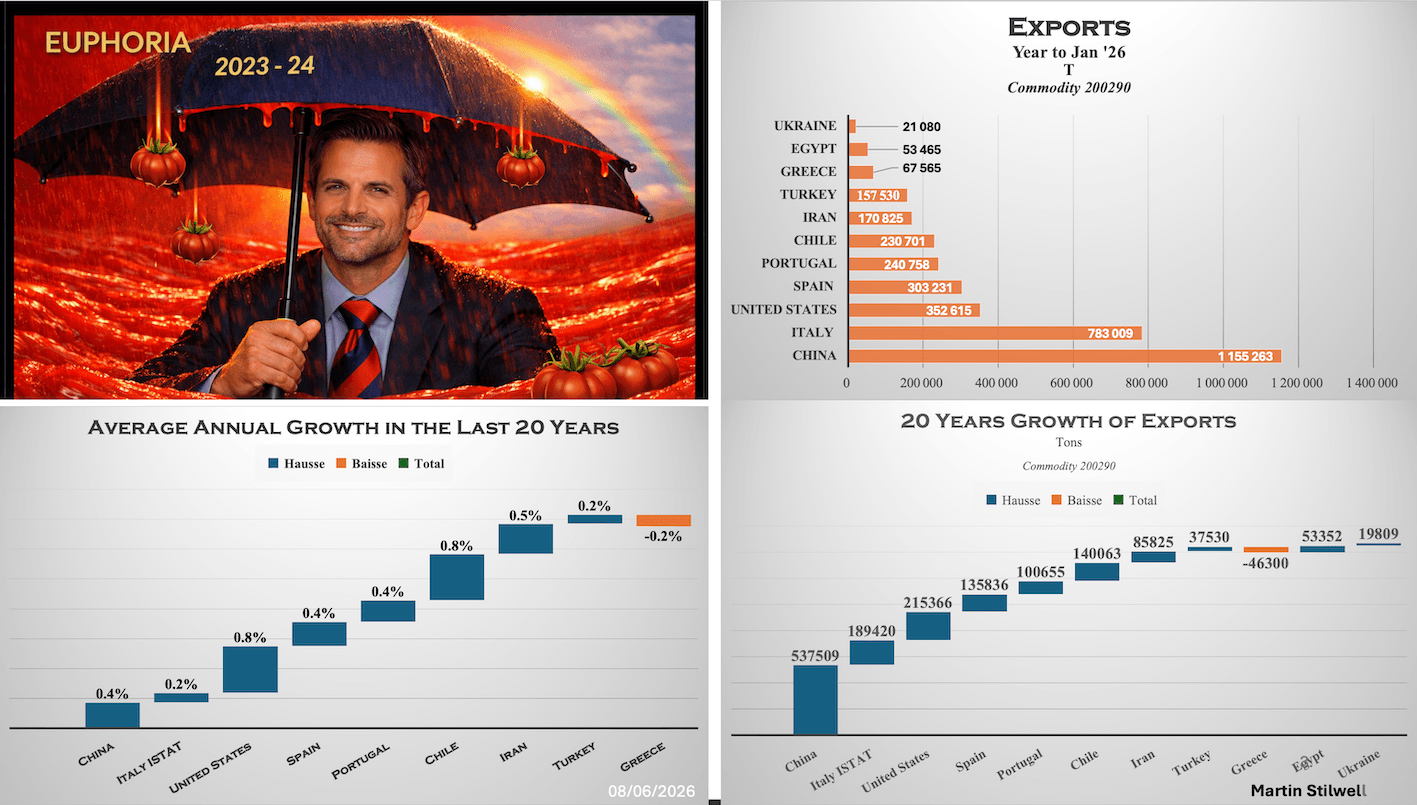
There is a fascinating trend in these graphs: if you look across the last two decades, we have actually seen significant market growth. It varies by country and percentage, but it is growth nonetheless. We heard from various speakers this morning that the market is static. I disagree; it isn’t quite that static. From one single year to the next, it might look flat, but when you look at the longer macro-period, it is absolutely growing.
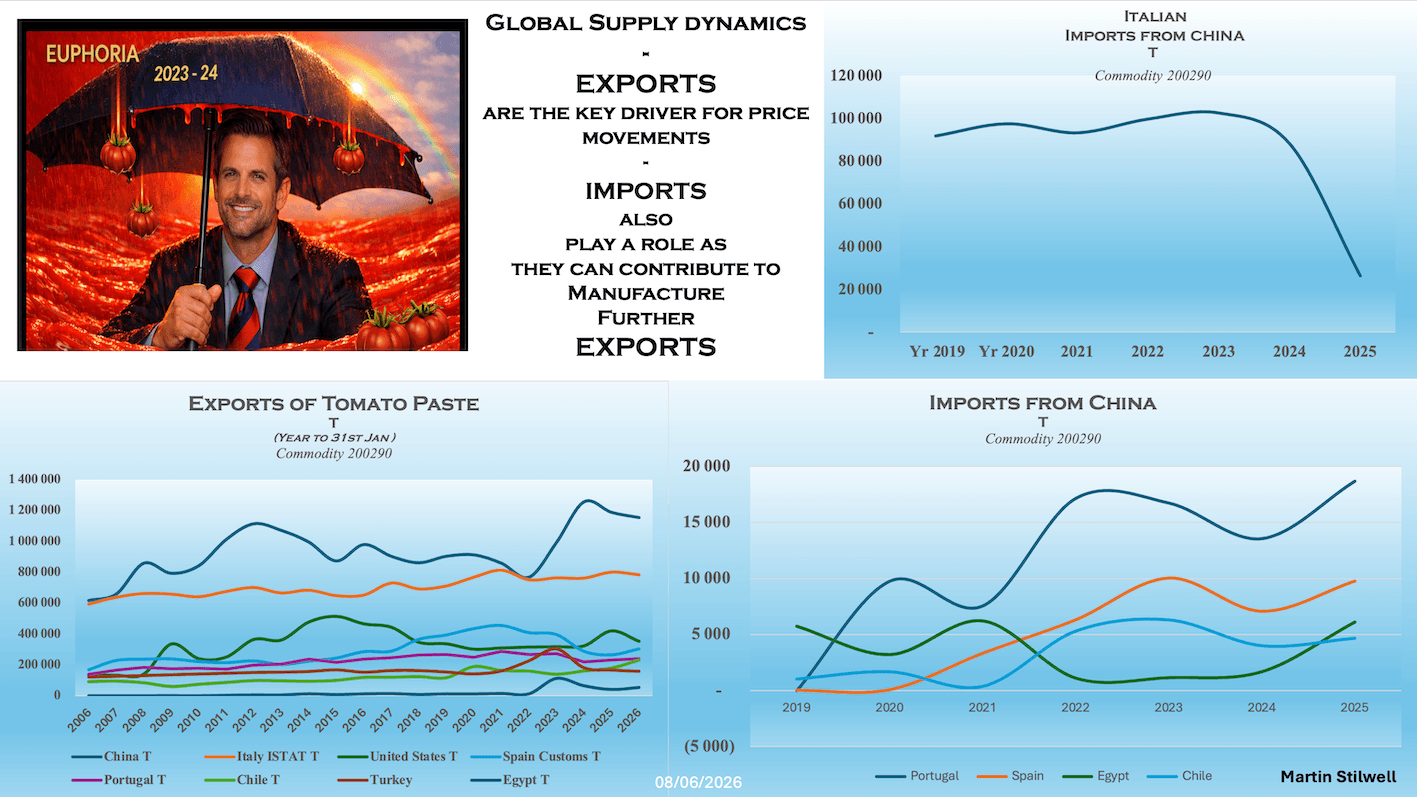
It’s also worth noting that global exports are heavily intertwined with imports, as several countries import raw product only to reprocess or re-export it. For instance, China sells to a massive number of countries that subsequently re-export that material in one way or another. Italy is a fascinating example here: they have fought fiercely against the use of Chinese paste in Italian tomato products, and they have been incredibly successful at fighting back against those major imports. On the other hand, I am surprised, shocked, and frankly upset to see that Portugal has become such a massive importer of Chinese products.
2025: Shifting Into Denial
Moving into 2025, we are still dealing with the lingering euphoria generated during the 2023–2024 seasons. This naturally brings us to the ‘Denial’ phase. In this slide, we see Jack surfing a massive tomato wave. As an industry, we have a collective tendency to put problems behind us and pretend they aren’t actually happening. Last year, most of us were probably thinking this supply pressure would just go away on its own—but it never does.
When we look at the core export numbers, three massive heavyweights stand out: China, Italy, and the United States. Even though Italy posts a very high export number, we must remember that Italy is an extremely effective marketer of its own culinary image. They are a massive exporter, but they are also a major importer—not just from China, but from various other locations. Because of this structural setup, a significant portion of that large Italian export volume doesn’t actually represent entirely new tomato volumes being placed onto the open world market.
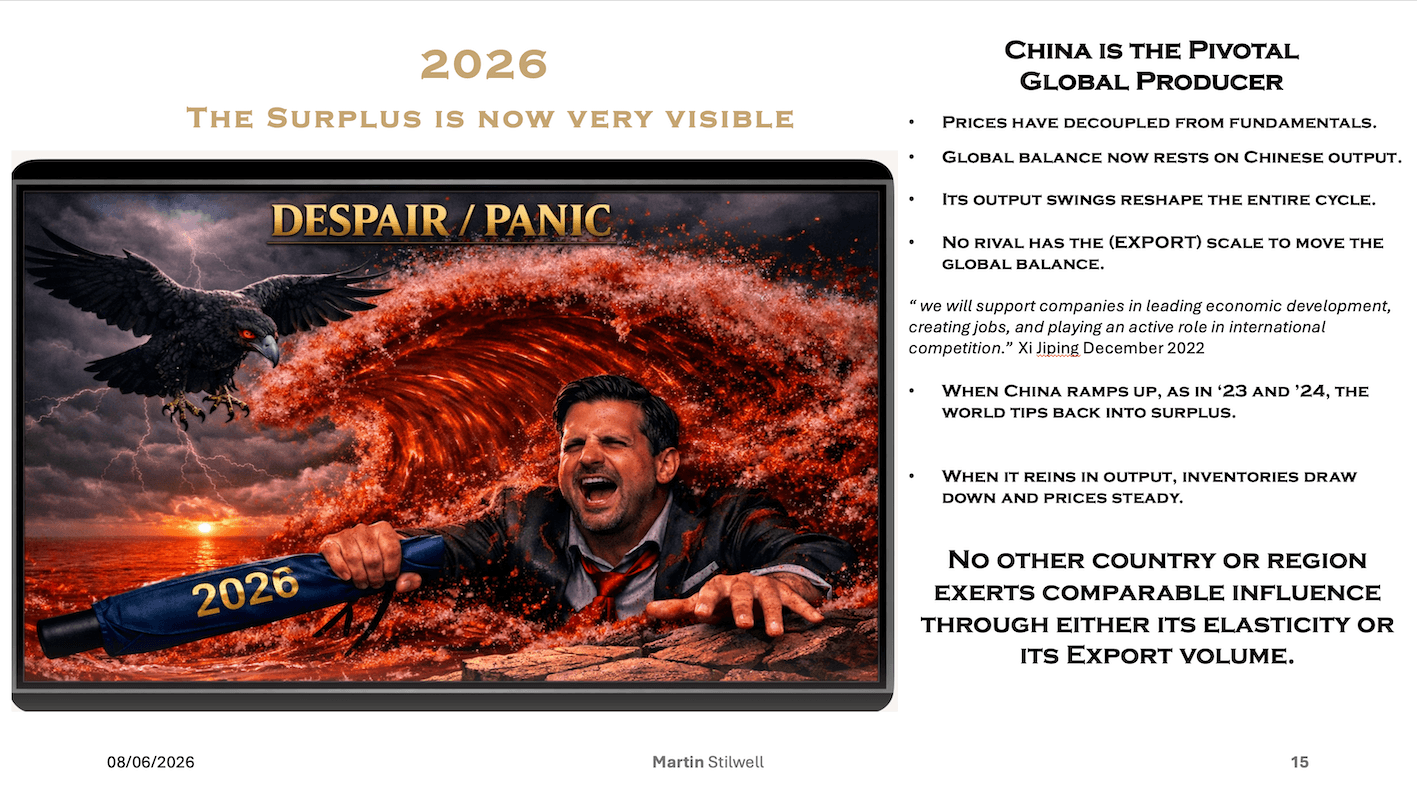
2026: The Depth of Despair
Now we arrive at 2026, which is the ‘Despair’ phase—the exact year we are living through right now. In the graphic, Jack has completely lost his depth. He has lost his surfboard, and the vultures are actively circling. Those of you who are older and have weathered these industry cycles before will recognize this immediately.
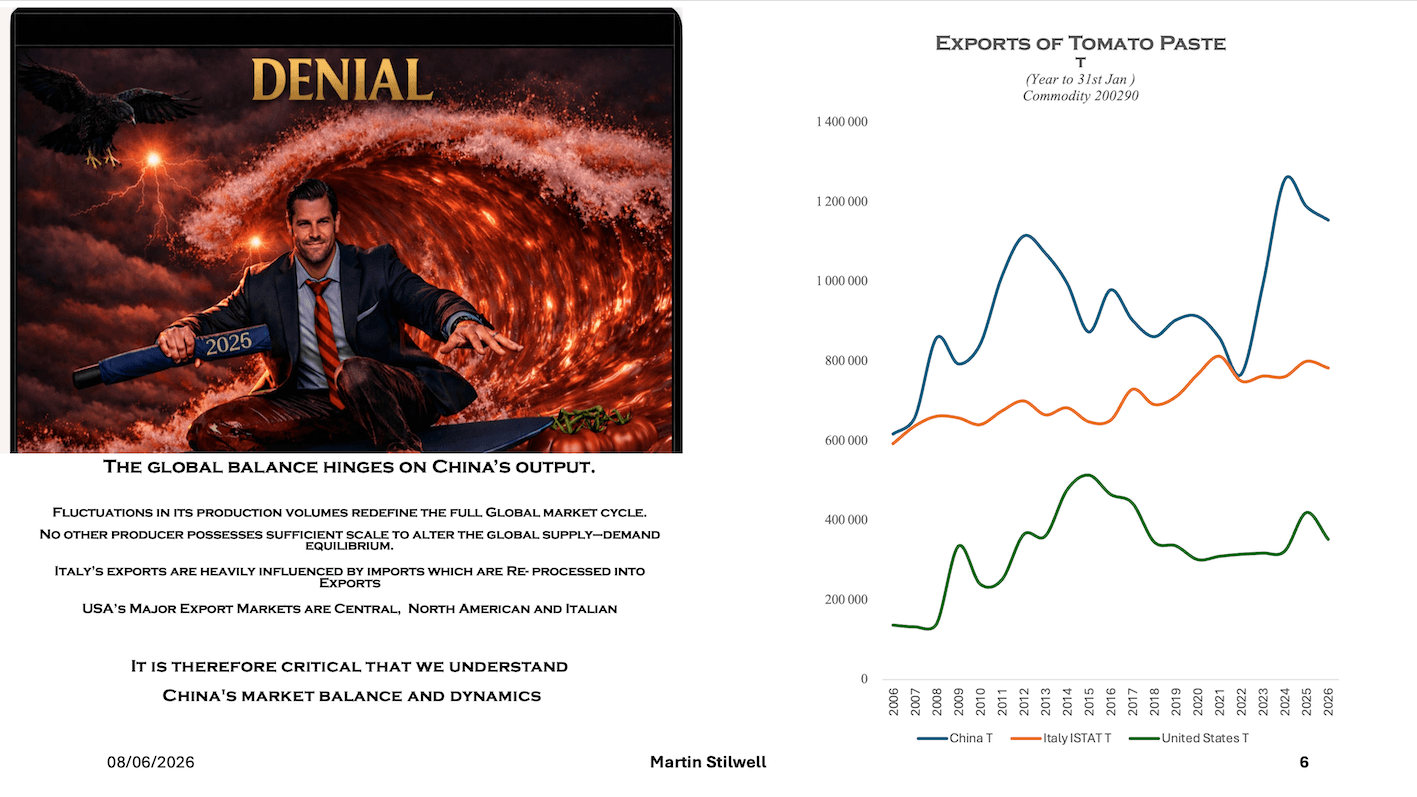
China is incredibly vital when it comes to establishing world prices. Because it is the only country operating on a scale massive enough to export those volumes, it exerts a dominant impact on global export prices, which in turn drag down internal domestic prices.
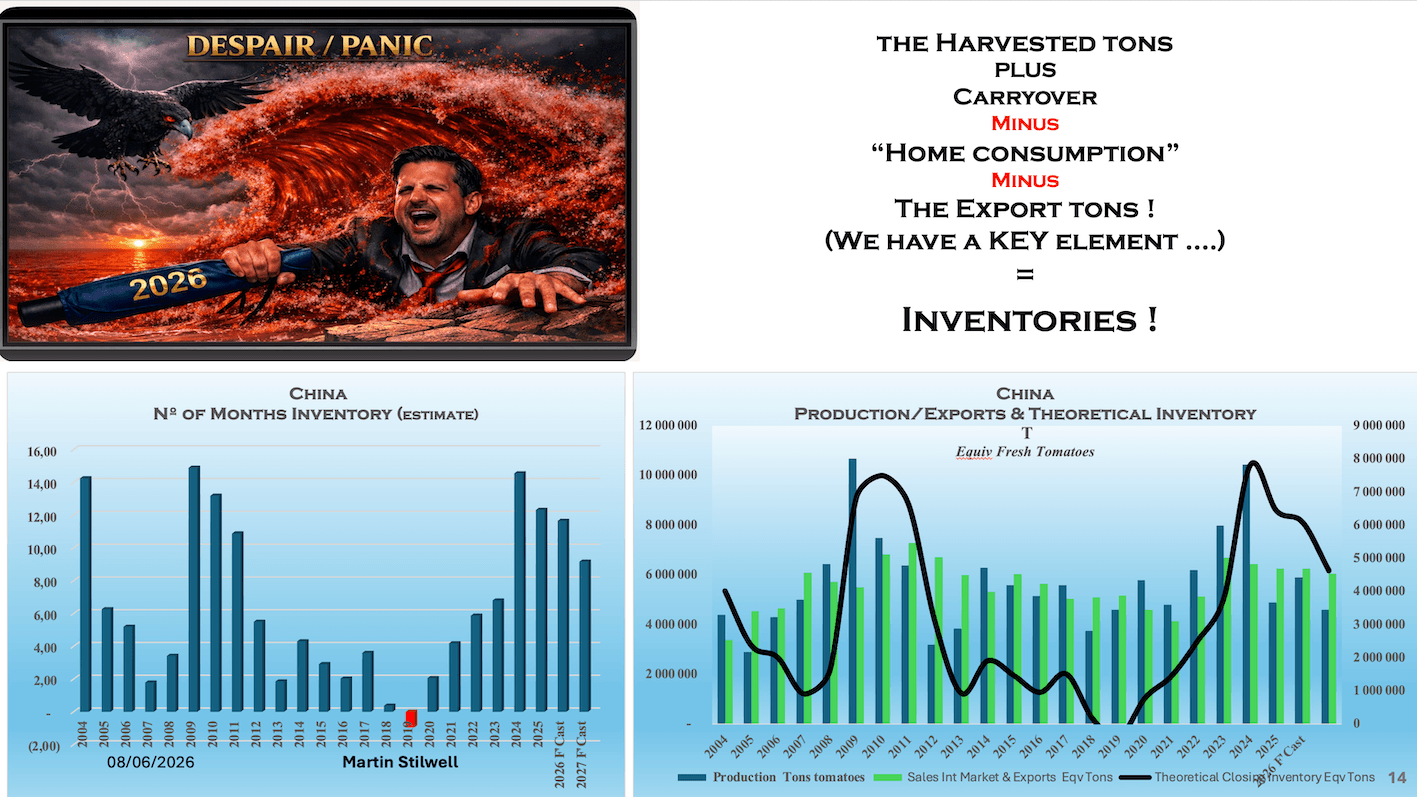
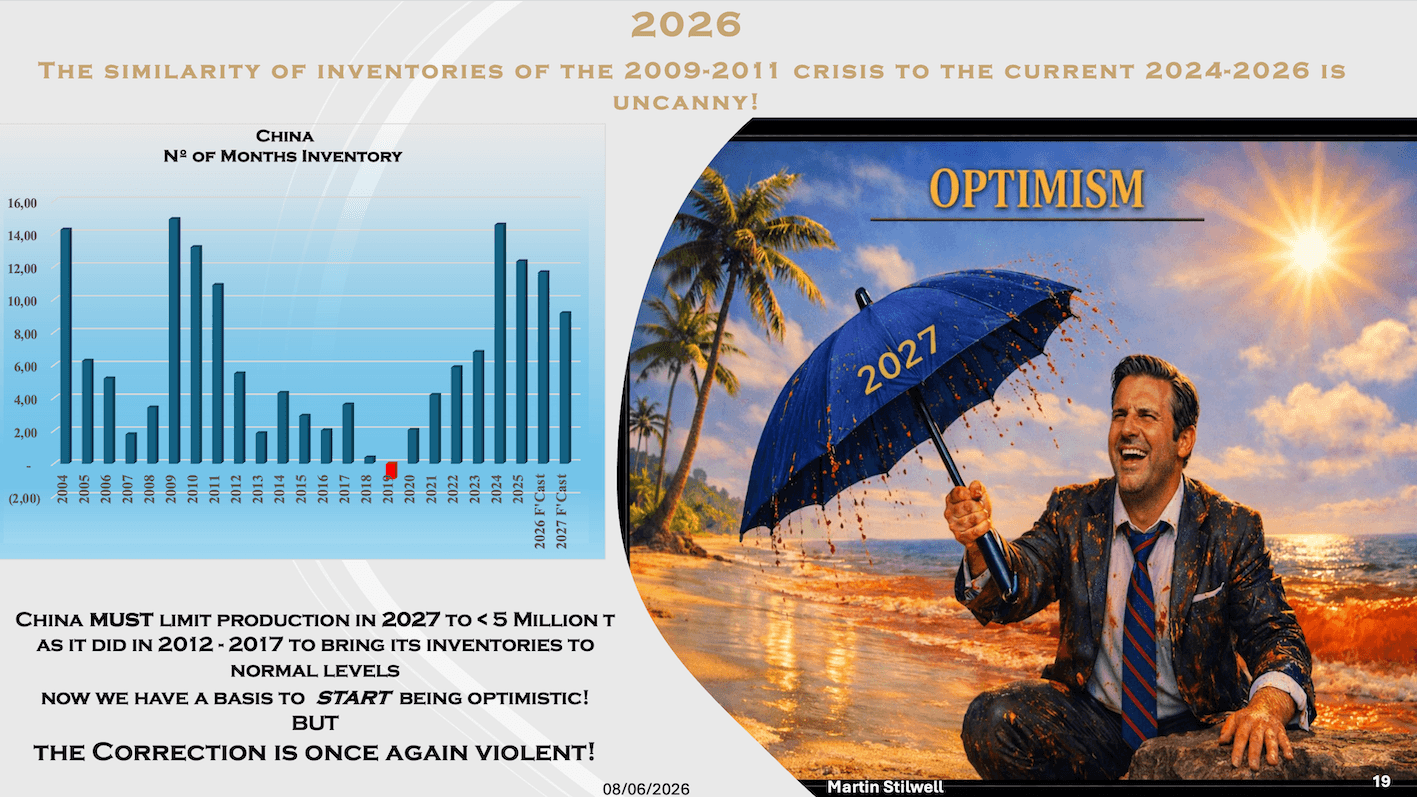
I put this specific historical slide up on purpose to illustrate our timeline. If you look back at the 2009, 2010, and 2011 period, most of us were around back then. We saw an enormous quantity of product produced, which hit us all with a massive impact. Effectively, we are going through the exact same phenomenon right now. It is genuinely astonishing how similar the current statistical graph is to the 2009 crisis.
Deconstructing the Chinese Data Puzzle
I spent time trying to truly understand the Chinese data, and a presentation this morning threw me out completely. Chinese numbers are notoriously difficult to interpret because, over the years—and I don’t like to say this without our Chinese colleagues present in the room—the official data hasn’t always been strictly accurate. This makes interpreting actual market realities highly complex.
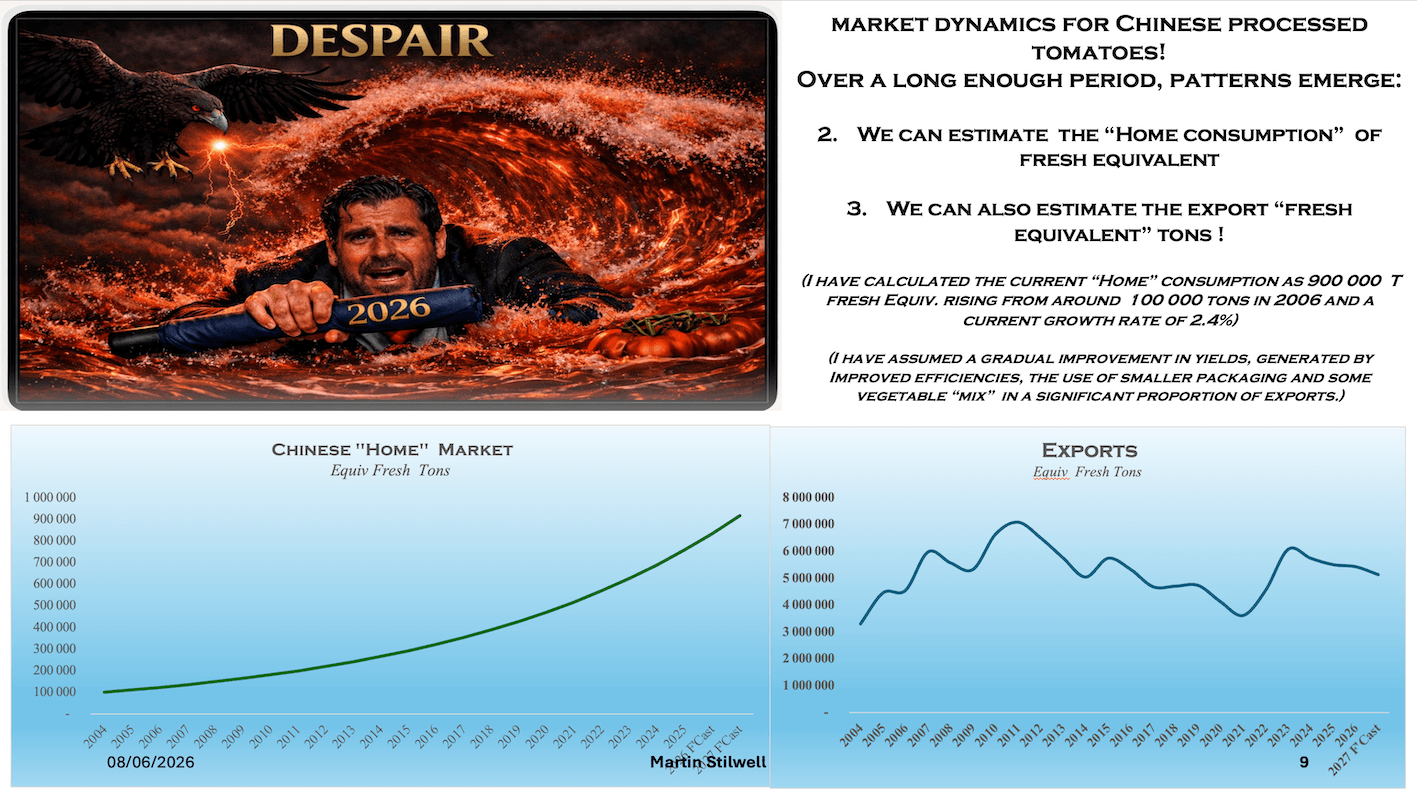
Using industry hearsay, historical experience, and decades of personal conversations with Chinese colleagues, I tried to independently construct a realistic figure for their internal domestic consumption—which we all recognize is a critical piece of the puzzle.
I remember nearly twenty years ago, when we were organizing the China Congress, being told that their domestic market was consuming around 100,000 tons, and that it was growing at a rate of 10% per year. Looking at modern data for the broader consumer market, the domestic consumption of tomato products in China is currently growing at around 3% to 4% annually.
So, I constructed a very straightforward model. It charts a growth deceleration running from 10% down to 3% over the last twenty years, starting from that original 100,000-ton baseline. This model brings us to a realistic modern domestic consumption of about 900,000 tons—perhaps a million tons. It isn’t meant to be an exact census figure, but rather to give us a reliable feel for reality.
Export numbers are much easier to verify because we have hard customs data. However, judging raw agricultural yield remains difficult because the nature of Chinese exports has shifted over time. Initially, they exported exclusively bulk industrial products. Over the years, they transitioned heavily into exporting small consumer cans. We also know from industry accounts—particularly from Italian processors from whom China has captured significant market share—that they frequently blend other vegetables into these tomato products.
In my early models, back when the majority of the product was high-concentration 36/38 paste, I assumed a processing yield requiring roughly 7 to 8 kilos of fresh tomatoes to produce 1 kilo of aseptic paste. Over time, that ratio has gradually come down. Today, I use a yield figure of 5 kilos of fresh tomatoes to 1 kilo of finished product. I don’t know if that is perfectly exact, but I suspect it is not far off the mark.
The Inventory Inventory Equation
Why go through all this calculation? Because every processor in this room wants to know what kind of inventory carry-over China is currently holding. It comes down to a simple spreadsheet formula:
Next Year’s Carry-over = Current Crop + Previous Carry-over – Domestic Consumption – Total Exports
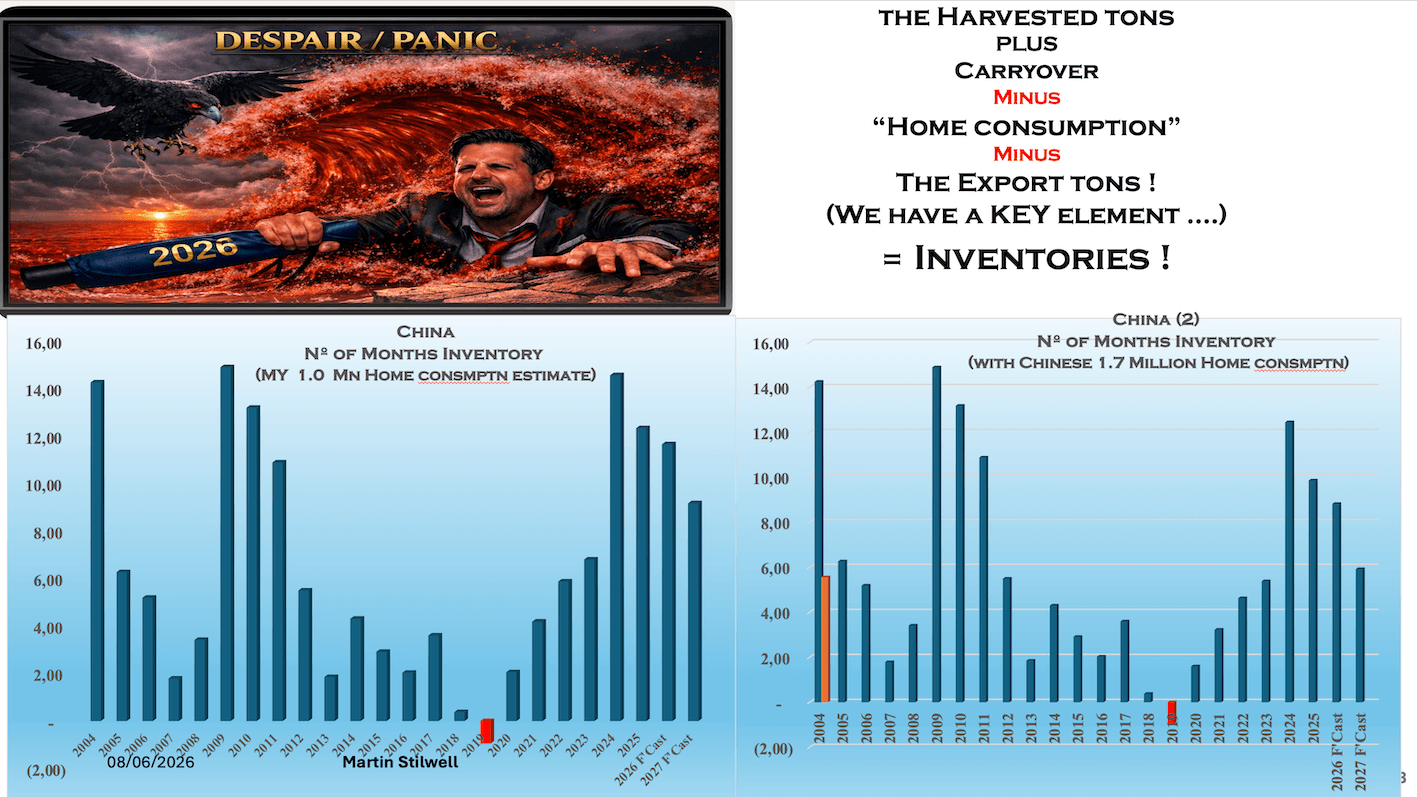
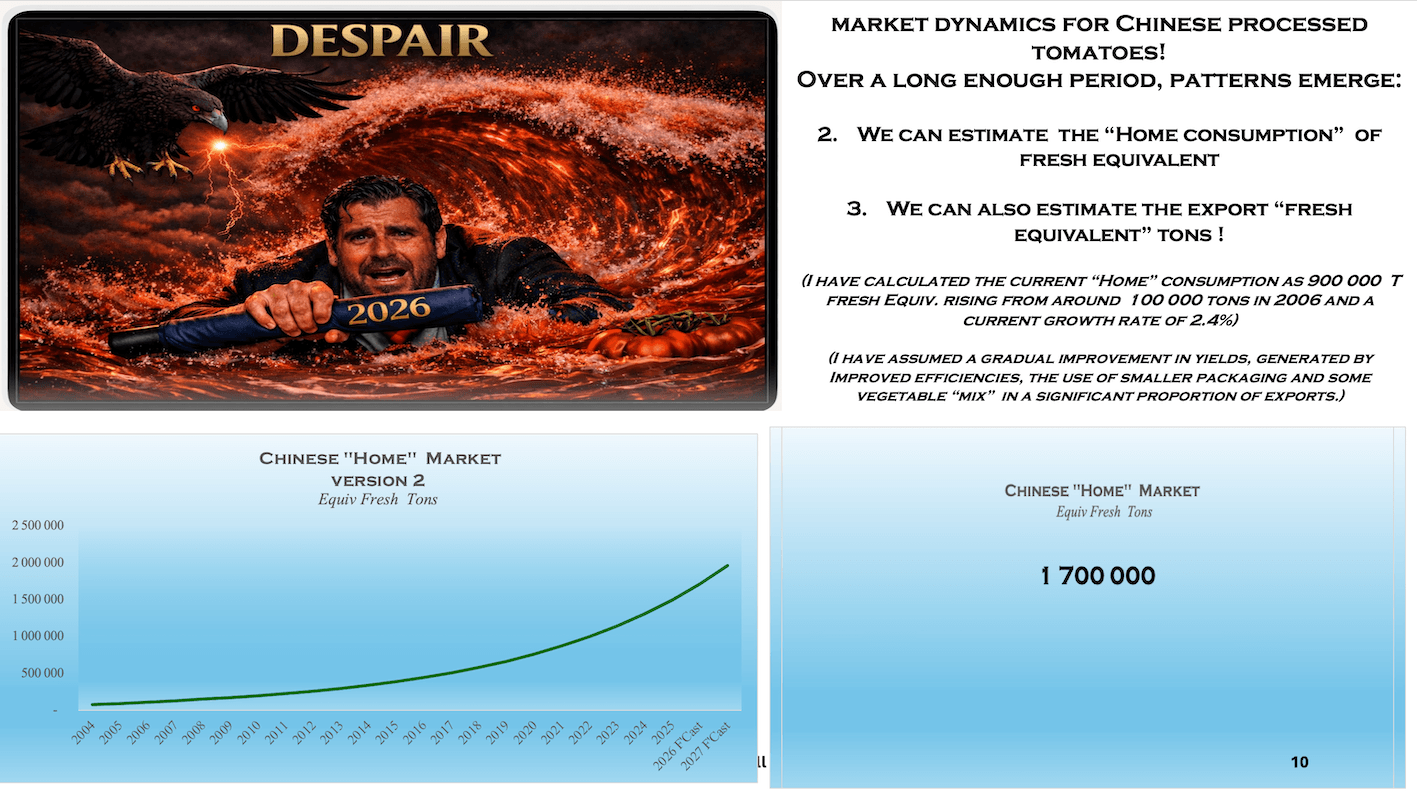
This brings me back to the data presented this morning that threw me off, so I actually inserted a new slide into my deck about ten minutes ago. On the left, you see my calculated model. On the right, you see the morning’s claim: that China’s internal consumption sits at a massive 1.7 million tons and is expanding at 10% a year.
If you deal with numbers regularly, the most interesting exercise is to run that 1.7 million ton figure backwards. Doing so implies that they consumed nearly 1.6 million tons just last year, which makes mapping out a logical global inventory graph very difficult.
If their domestic consumption genuinely is 1.7 million tons, the math changes completely. If they produce roughly 5 million tons of crop this year—and they were hinting it might be slightly less—you subtract that 1.7 million tons of domestic use and you are left with a minuscule export surplus. It would represent such a minor correction for China that it would barely impact the global export market. In fact, if they maintained that same crop size next year under that model, we would eventually find ourselves selling paste to China!
I have included both scenarios side-by-side in the deck: one assuming a 1.7 million ton internal market, and the other assuming a 1 million ton internal market. In all likelihood, neither is perfectly accurate, but together they give you a clear flavor of the dynamics at play.
Operating Realities: China vs. California
The reality remains that China is the only processing region capable of single-handedly driving down global export prices. California technically has the raw capacity to do it, but they historically never have.

California looks at the export market through a fundamentally different strategic lens: they use exports to extend their active processing season by an extra two, three, or four weeks. This allows them to run their plants longer, secure an extended market, and dilute their fixed unit costs.
Managing fixed costs is one of the single biggest operational headaches we face as tomato processors. We invest tremendous capital and resources into building these enormous, state-of-the-art plants, yet we typically only utilize them for a very brief window each year. Being able to stretch operations for an extra month via exports is an enormous financial advantage. California uses exports for asset utilization. China, by contrast, faces hard climatic limits. Their season is incredibly short—very similar to Canada—where they start early and finish early due to definitive, killing frosts that arrive from mid-September onward.
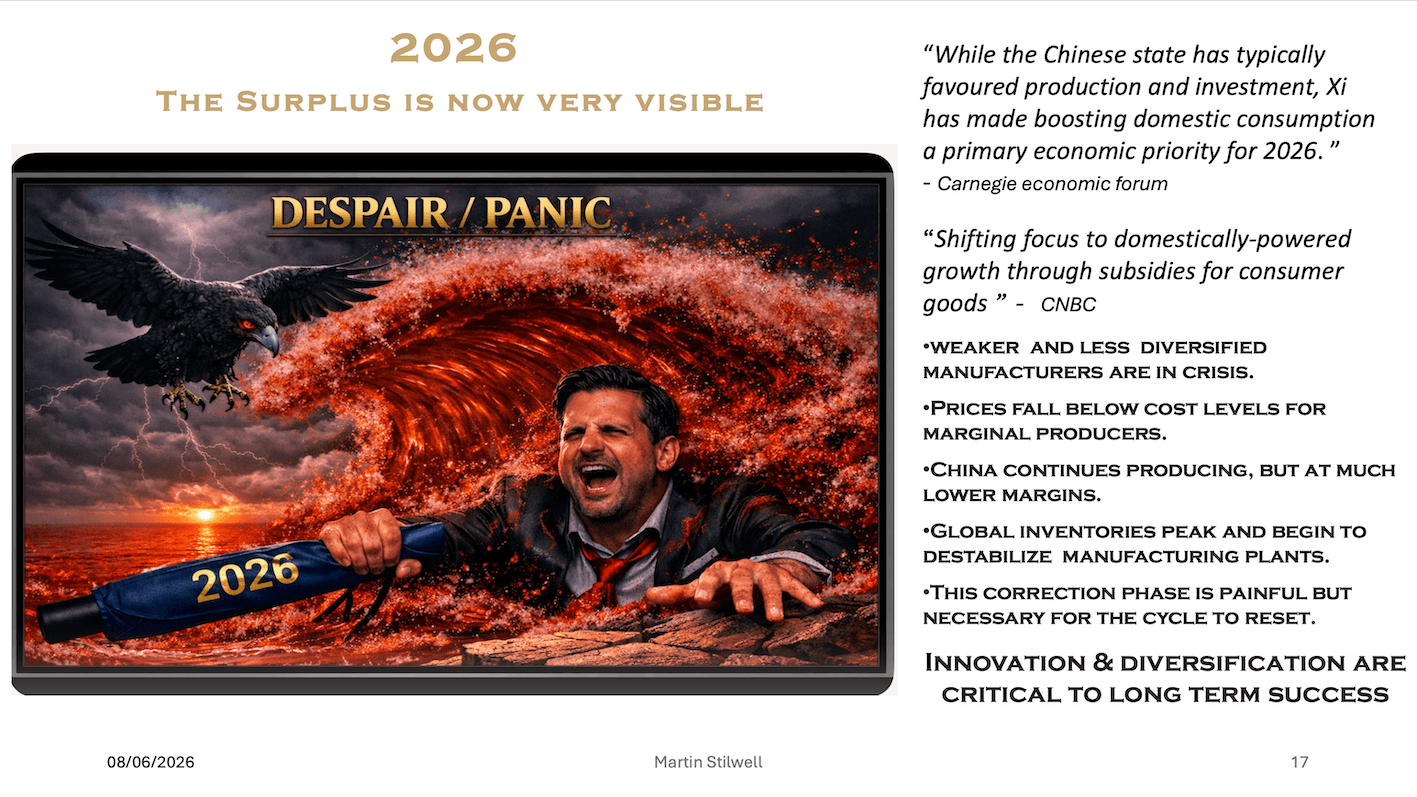
This brings us to the ‘Panic’ phase. Unfortunately, we are going to see a repeat of previous downturns. Processing companies that are more marginal, located in difficult agricultural zones, or lack product diversification and localized markets could very well disappear during this stretch. It is a painful structural correction, and I fully expect it to happen.
I must remind everyone here of a core truth: while diversification and product innovation are vital to securing our future, we can never afford to take our eyes off basic commodity supply metrics.
2027: From Panic to Looming Optimism
By later in 2027, we transition into ‘Optimism.’ In the slide, the sea of tomatoes has finally calmed down. Jack still has some juice left, and he’s starting to look a lot happier. We begin entering the period where the macro-market moves back into a healthy balance. Unfortunately, getting there requires a violent correction.
What makes our current 2026 environment uniquely serious is the aggressive rise in input costs. Grower operational costs are skyrocketing. Even though we as processors hold firm contracts with our growers, those farming margins are being severely squeezed. Simultaneously, our own energy costs are up, packaging costs are up, and interest rates are almost certainly climbing higher—quite possibly even this week in Europe.
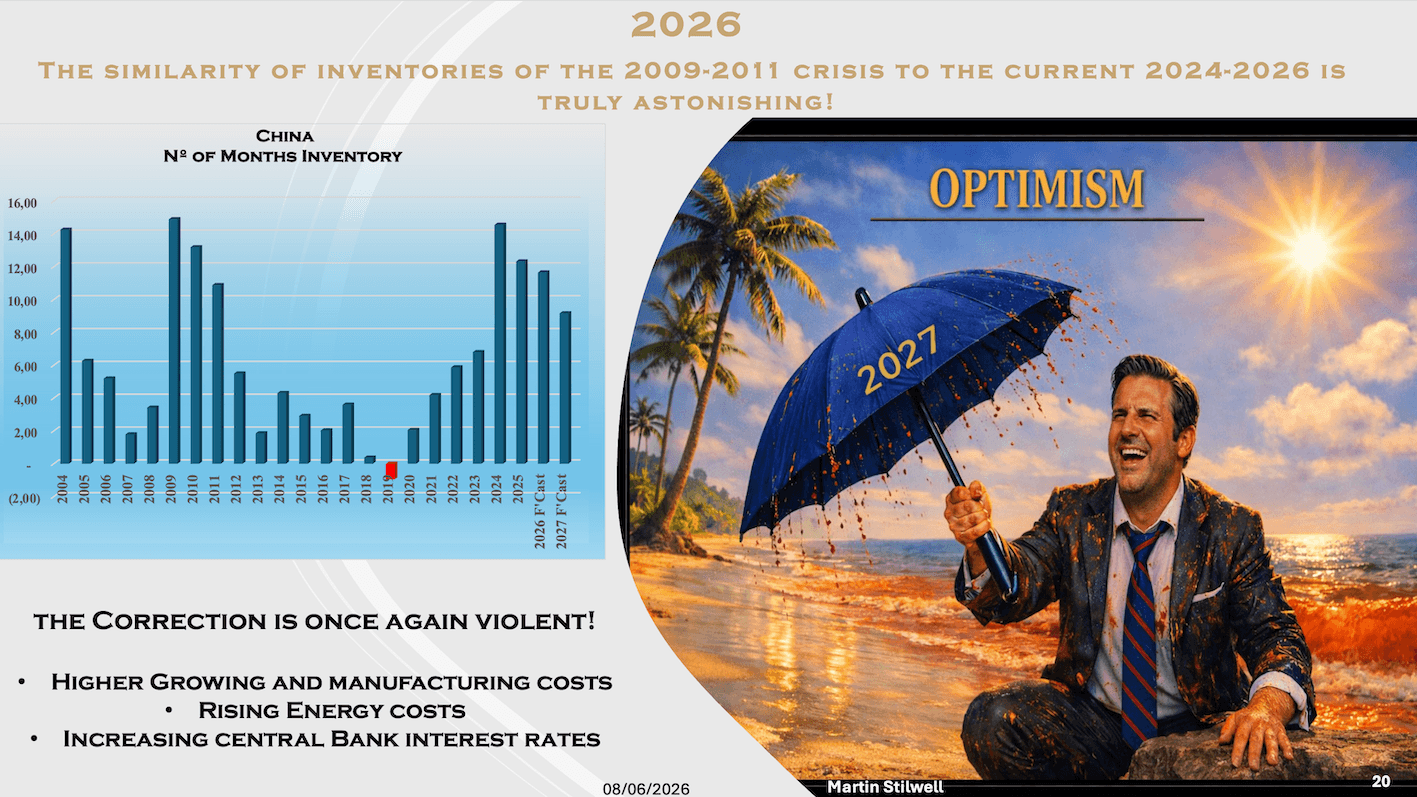
When oil costs remain high, inflation inevitably pushes through the supply chain. To rein in that inflation, central bankers have only one real tool: raising interest rates. Higher interest rates are uniquely brutal for a seasonal industry like ours. We are a structurally difficult business because we must spend our entire annual working capital in a tight two-to-three-month window, and then we wait to get paid back gradually over the subsequent 12 to 14 months. That lag makes interest rates absolutely critical to our survival.
2028–2032: The Reset and the Next Wave
By 2028, I believe we will be entirely through the worst of it. Jack is looking confident again. We will see the market settle completely.
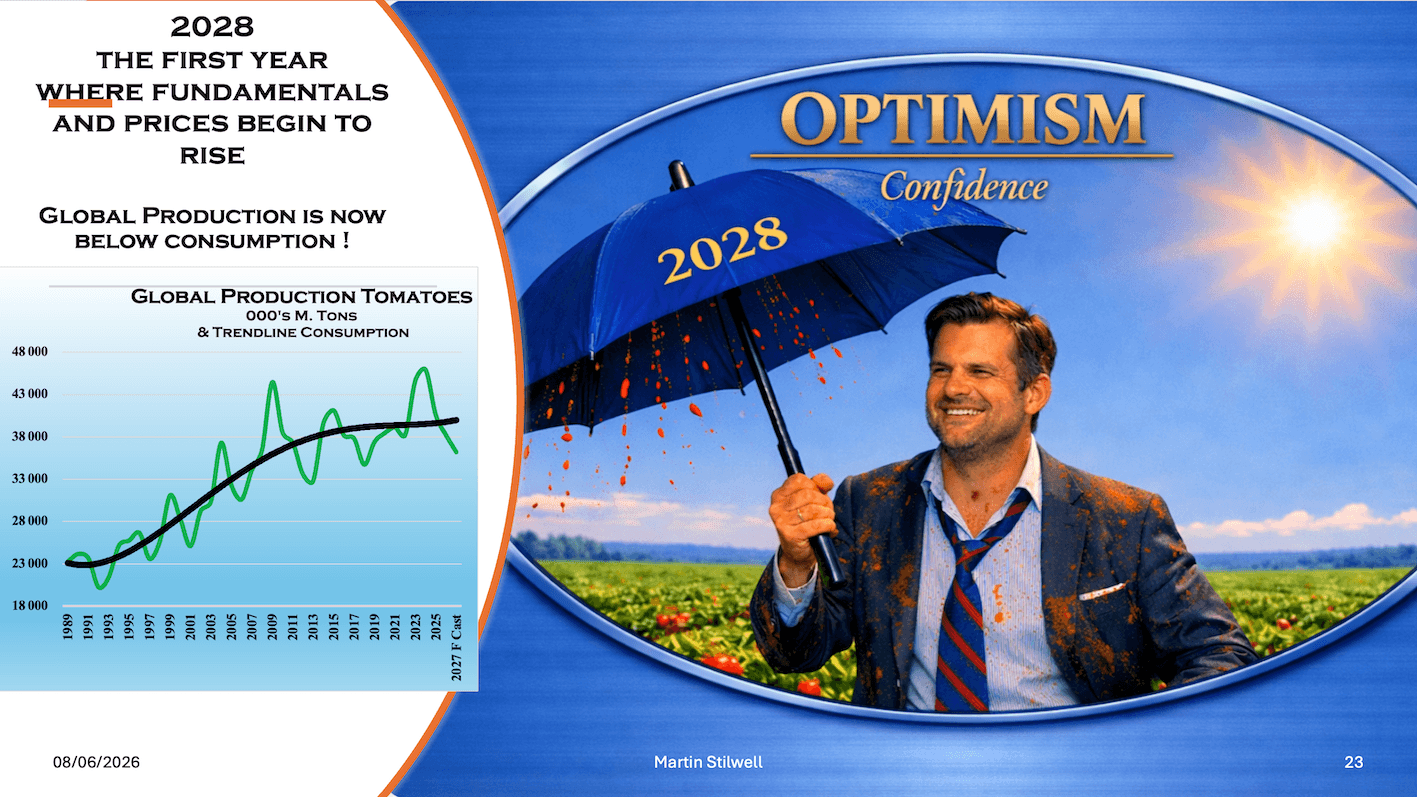
As you can see on the production graph, global output will actually drop below long-term average consumption for the first time in years. This supply deficit will deplete excess inventories and trigger positive price movements, benefiting growers and processors alike. The graph clearly maps these two massive historical production peaks: first in 2009, and now our matching peak in 2024.

Finally, we return to ‘Euphoria.’ Jack is totally calm, relaxing on the beach, enjoying the sunshine, and eating tomato ice cream. But if you look closely at the horizon of the graph… by 2031 and 2032, the vultures are starting to circle all over again.

That is everything I have for you today. I hope you enjoyed the look ahead. It might not be an entirely joyful forecast, but I find the cyclical nature of it amusing anyway! Thank you.
Source: Martin Stilwell’s talk, WPTC Congress 2026


