News
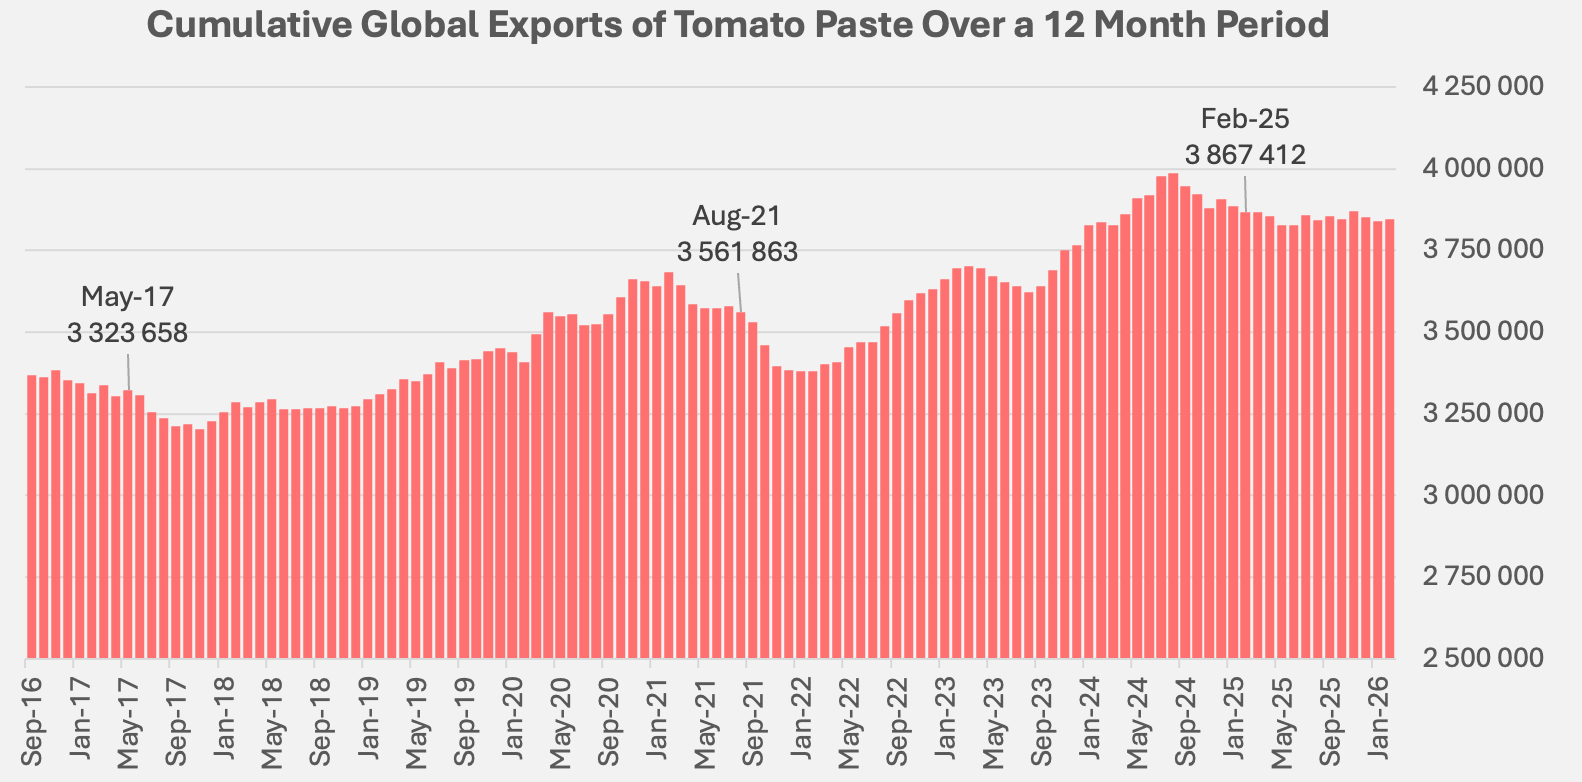
Global Exports of Tomato Paste, Updated June 16, 2026
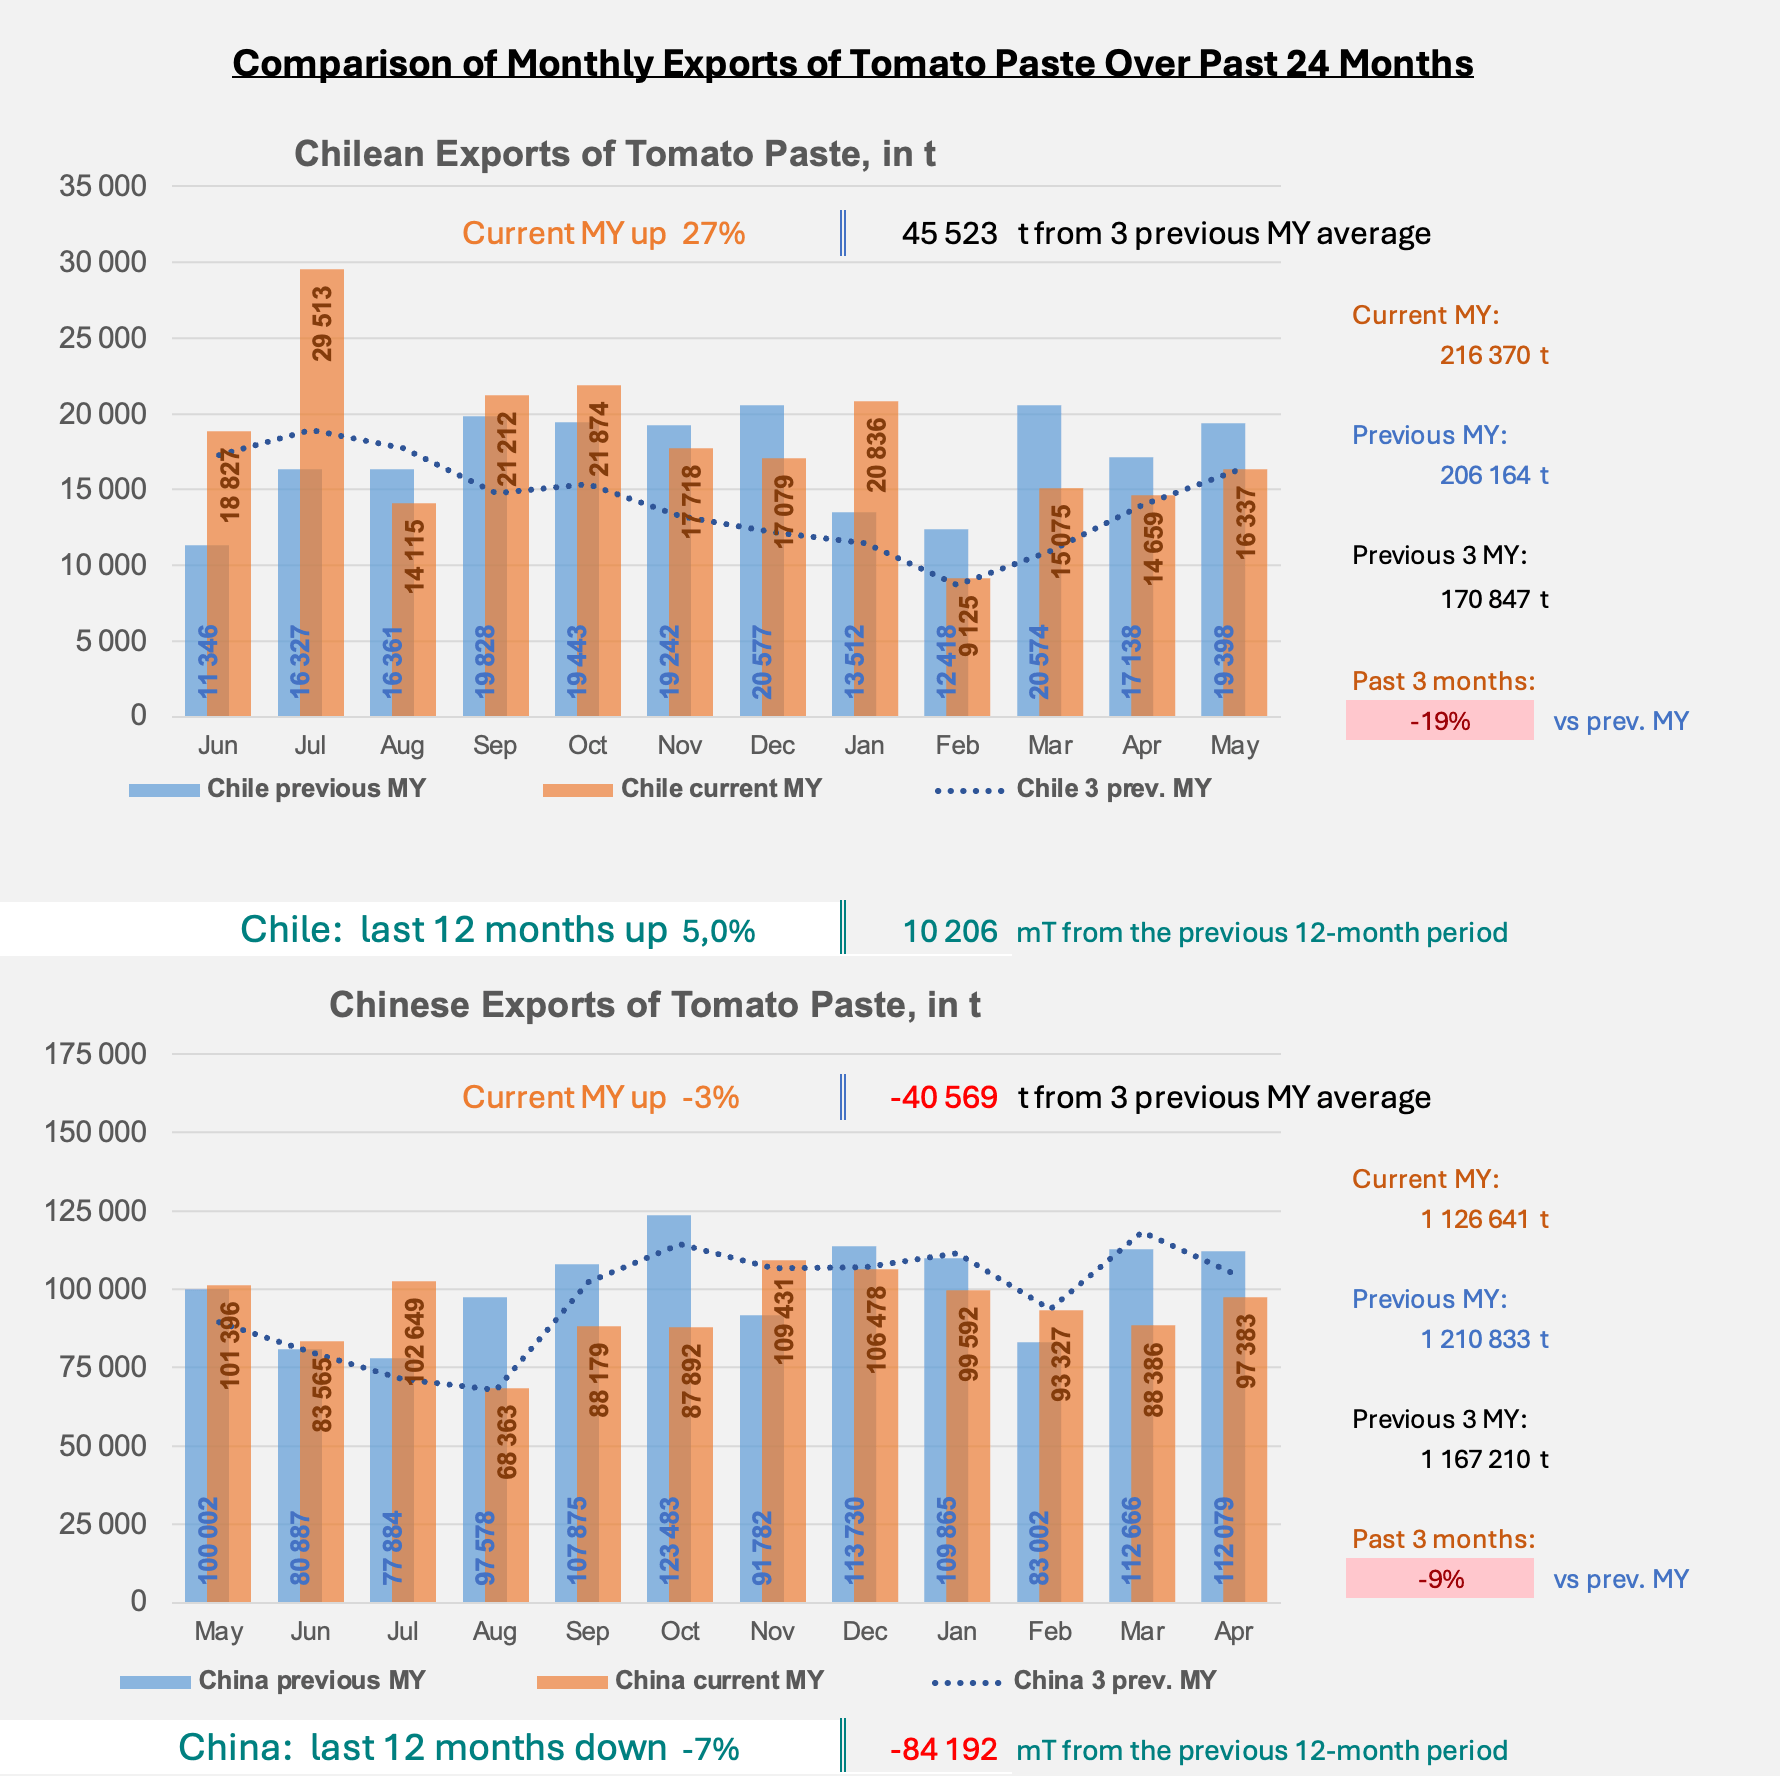
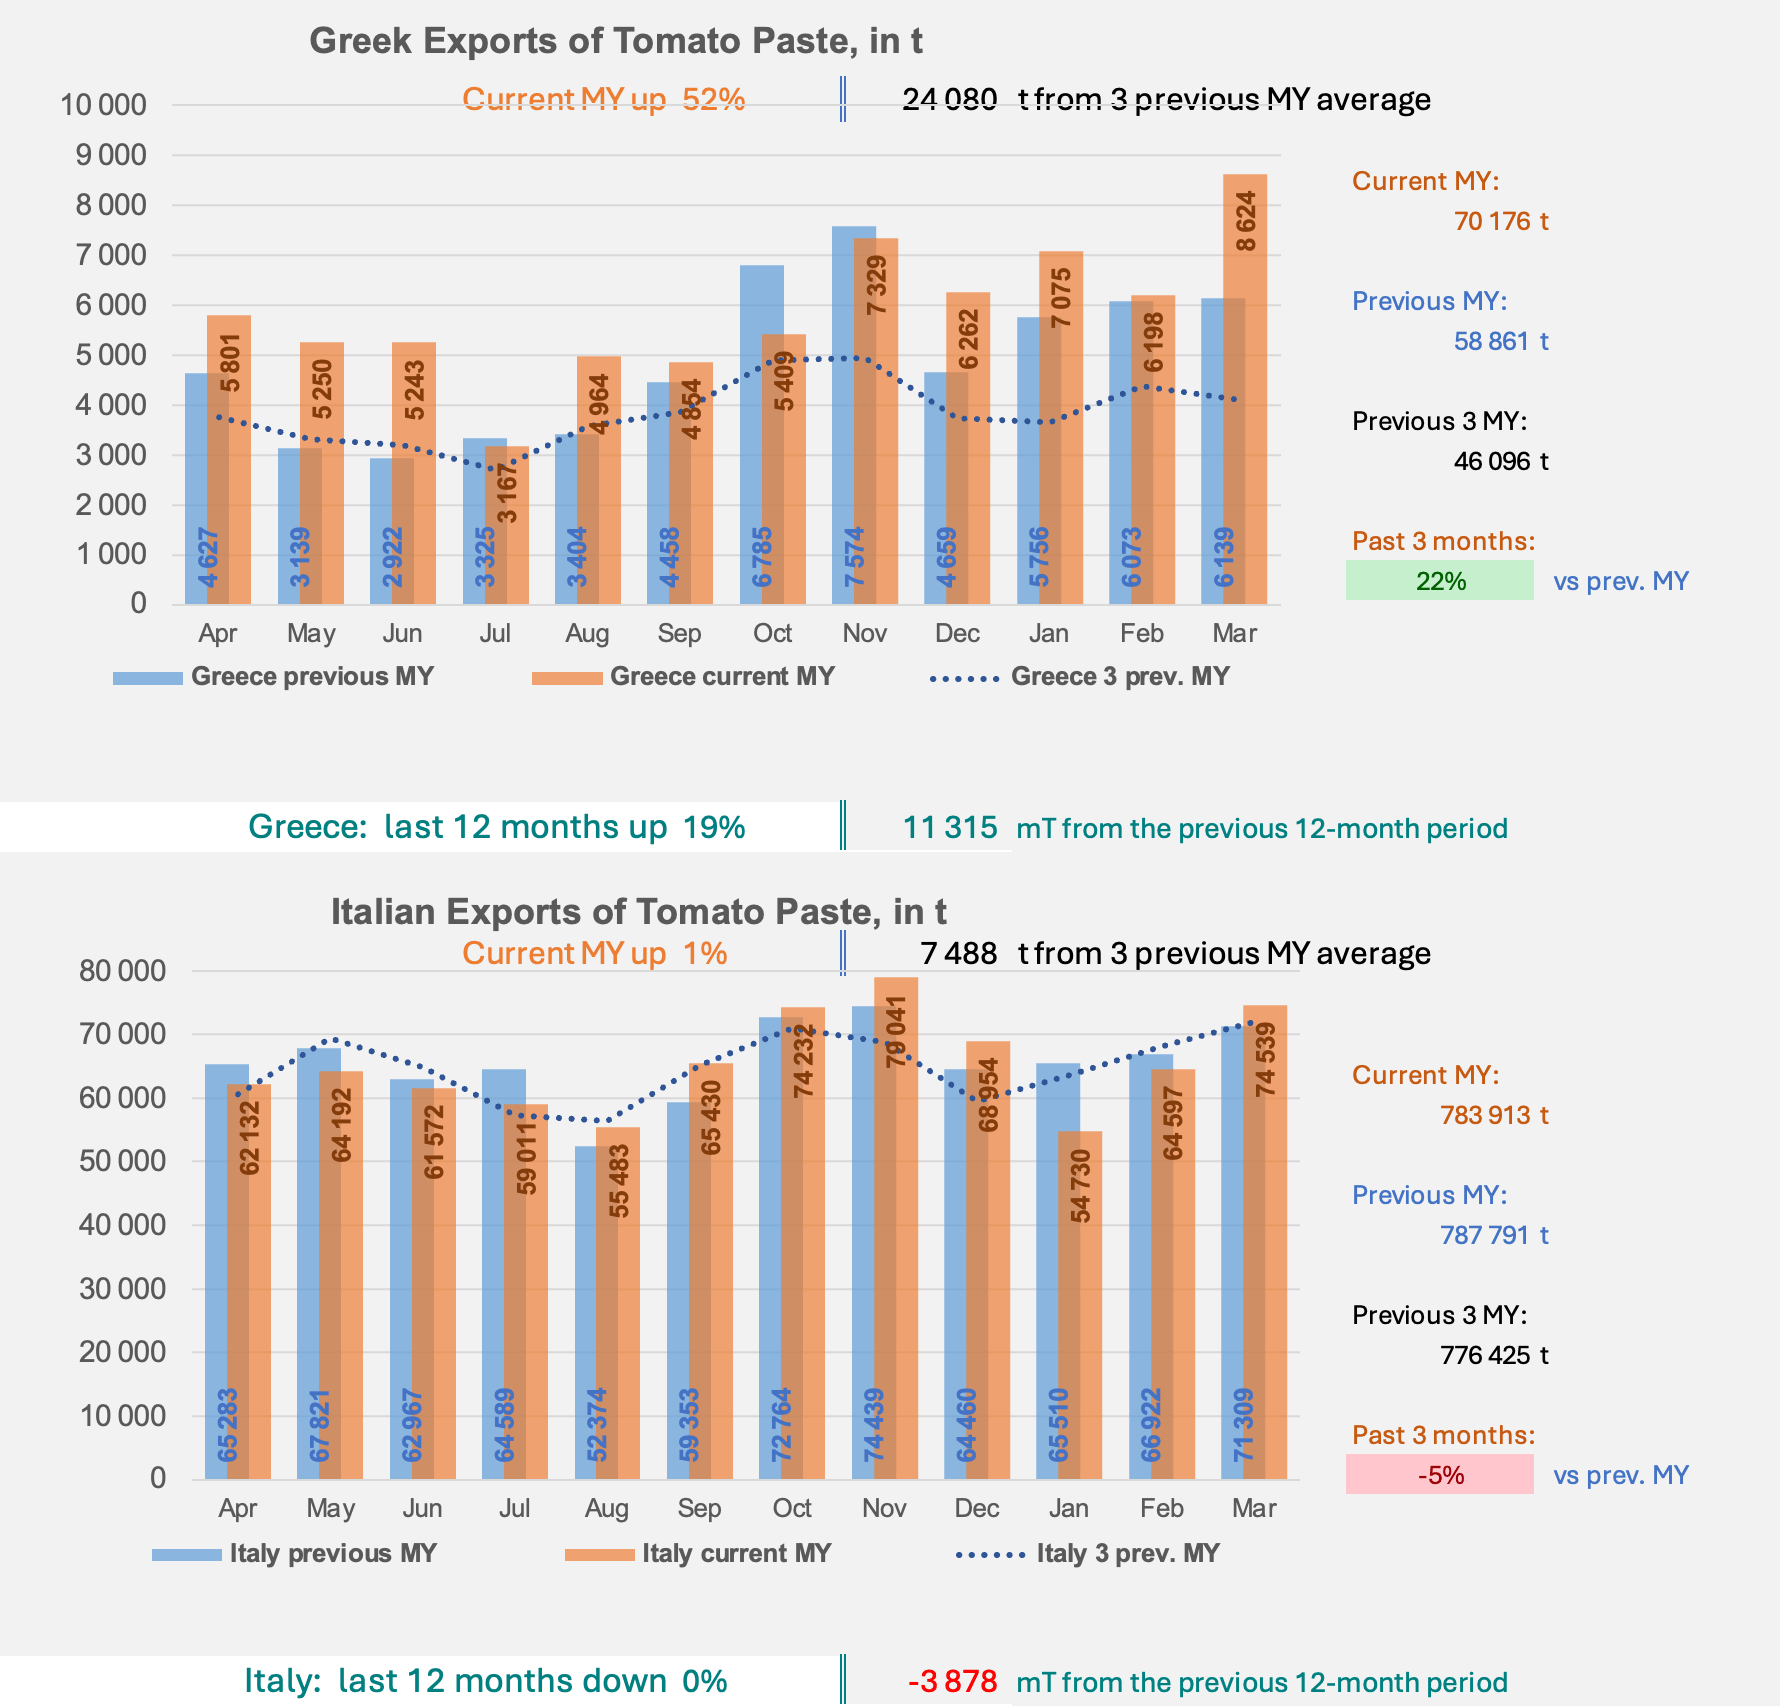
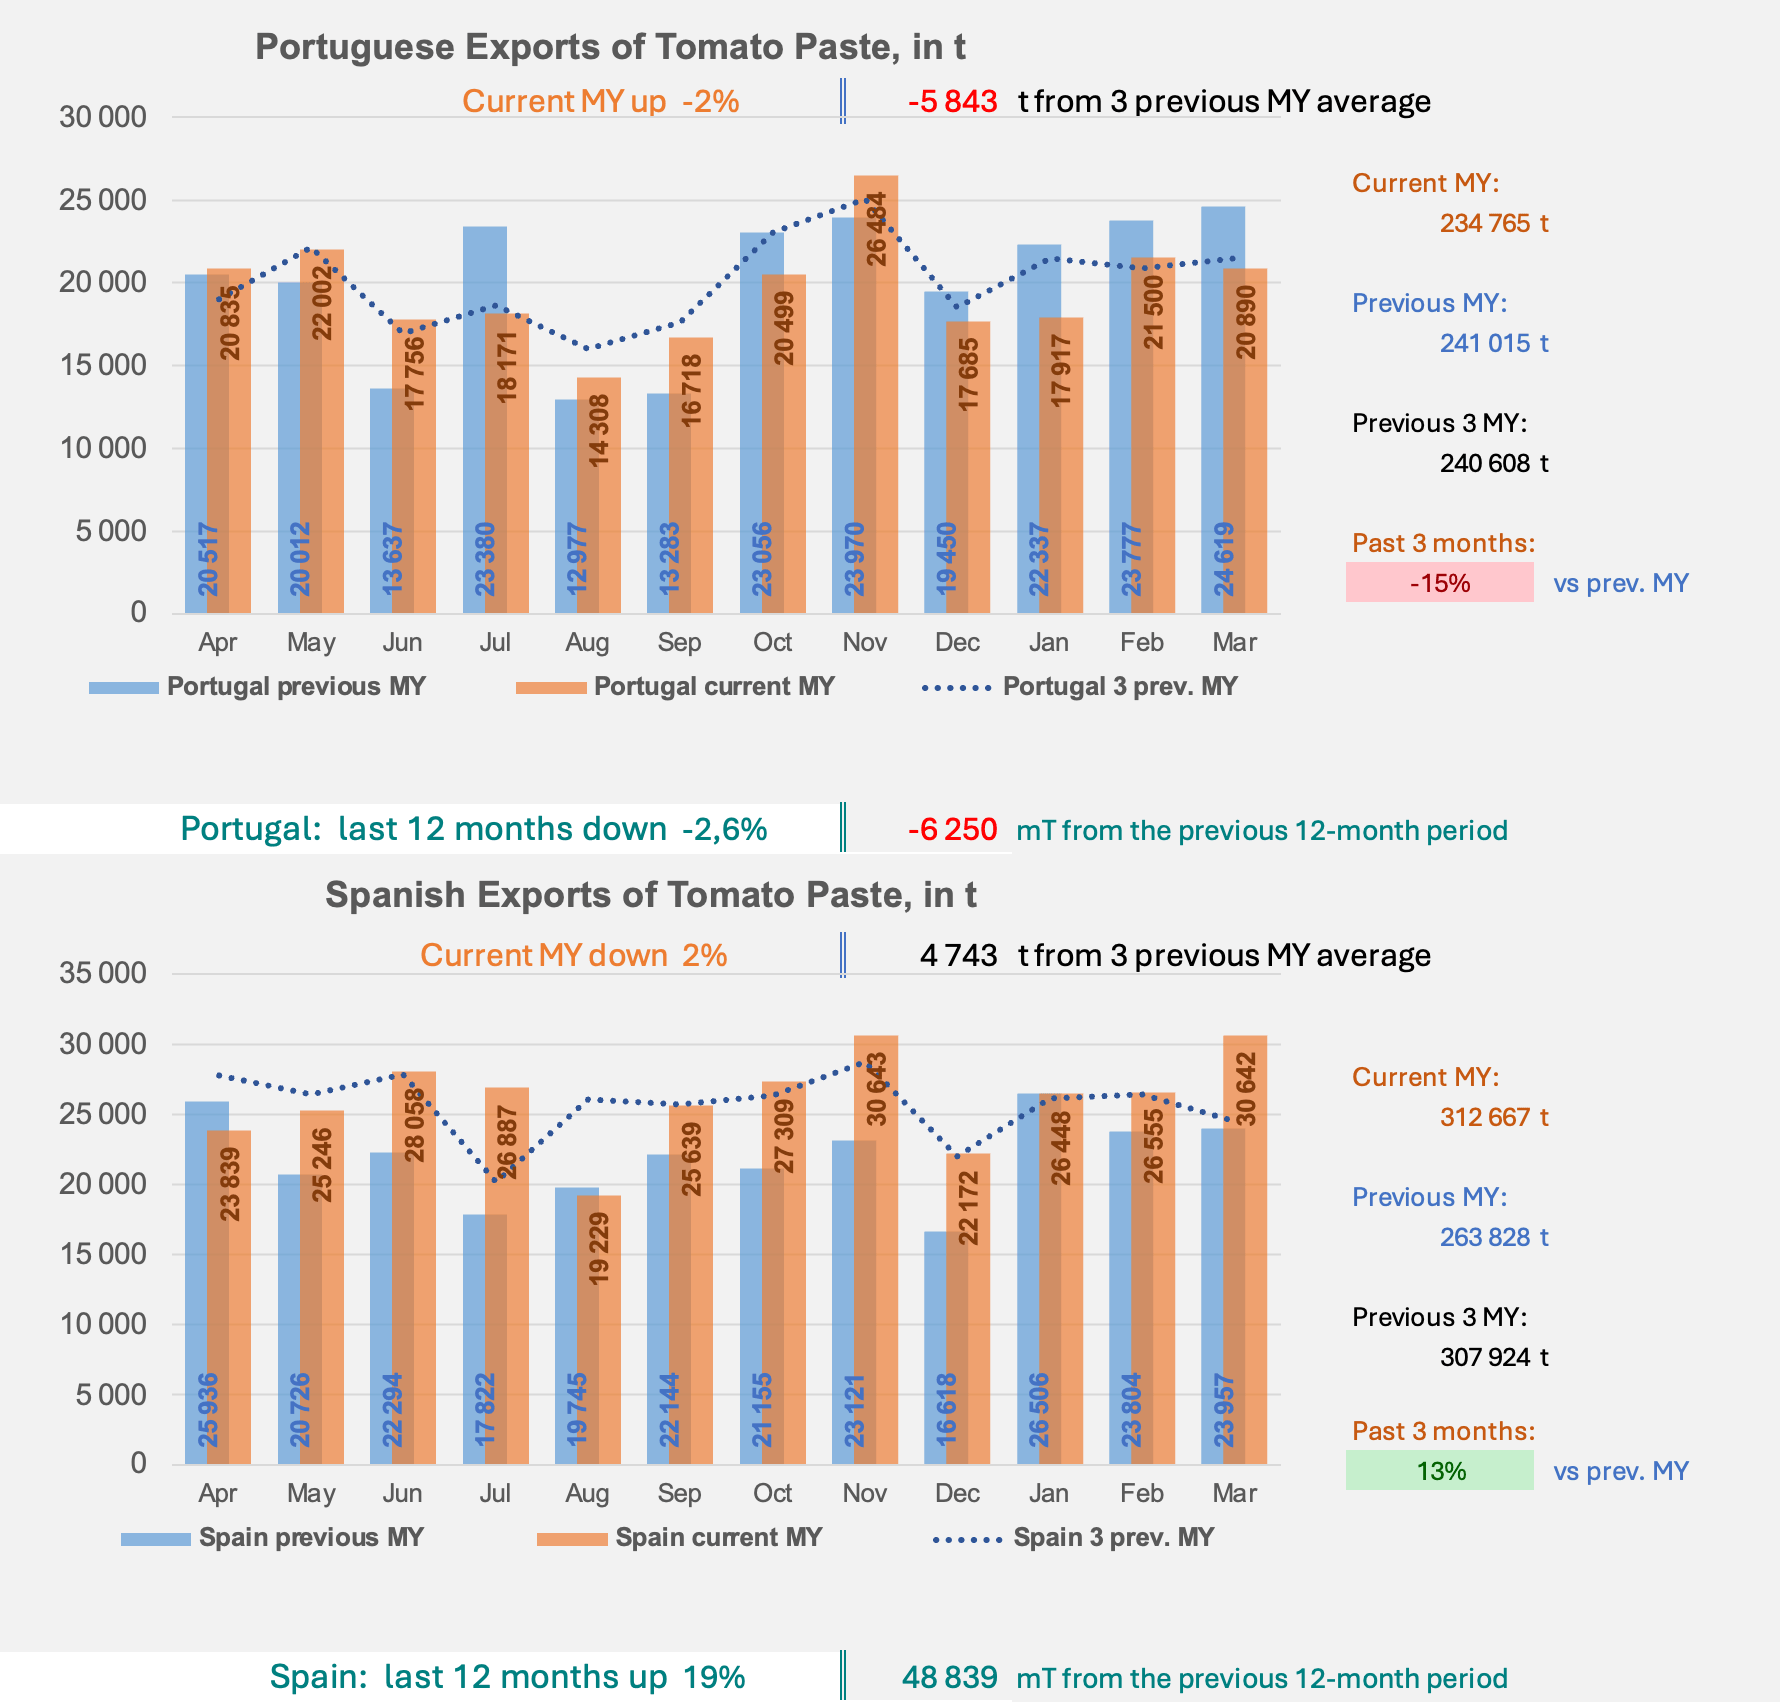
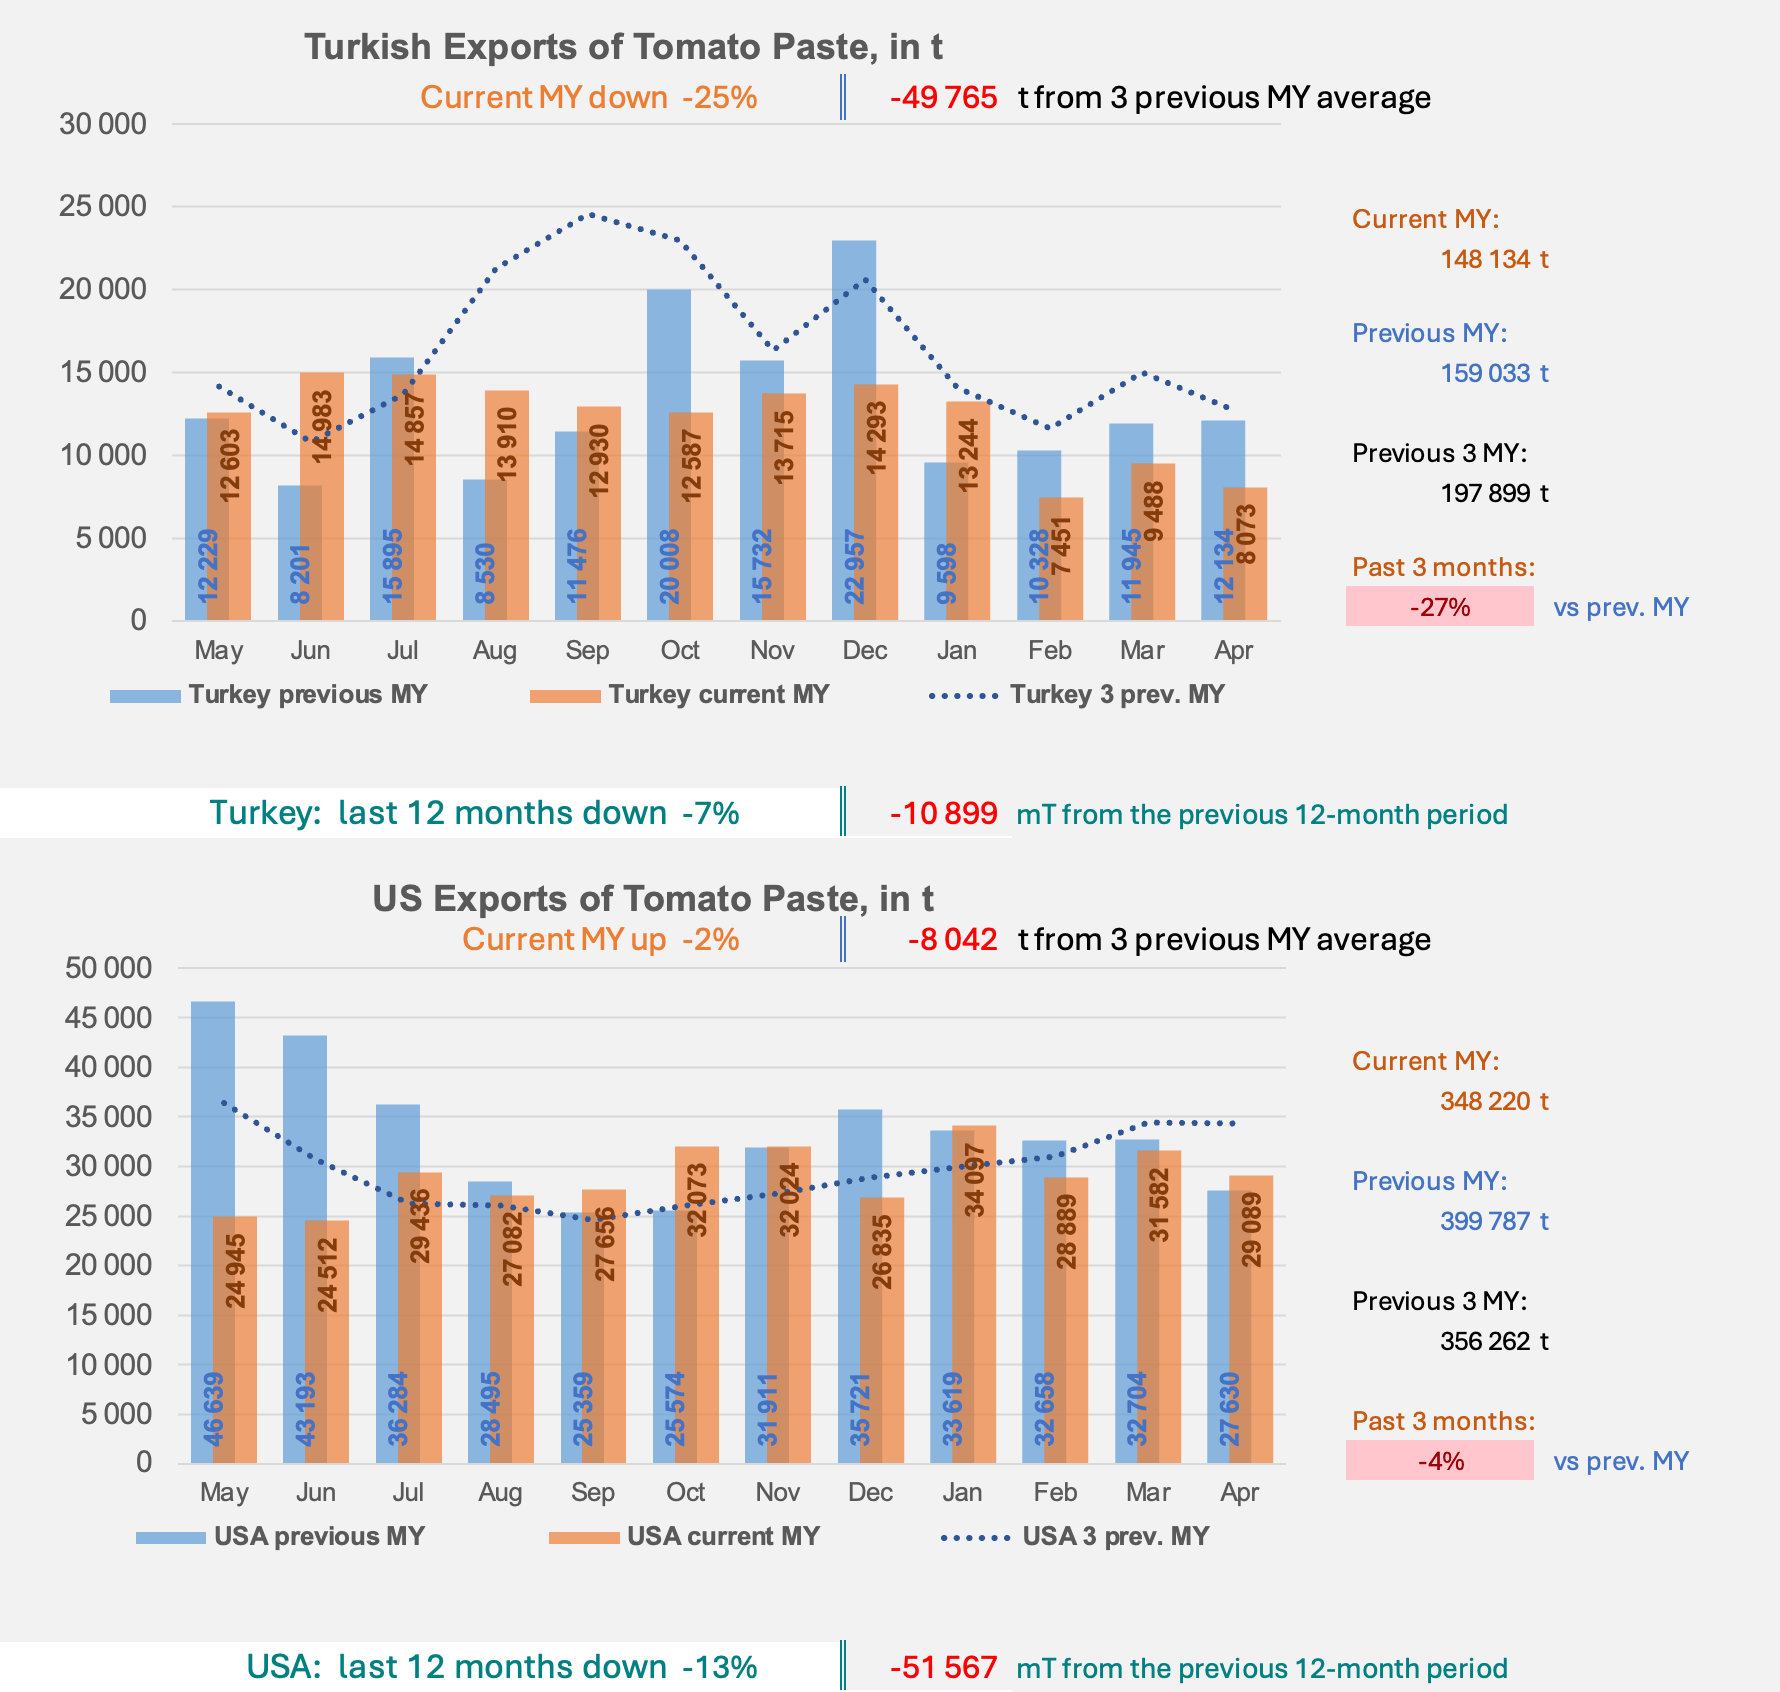
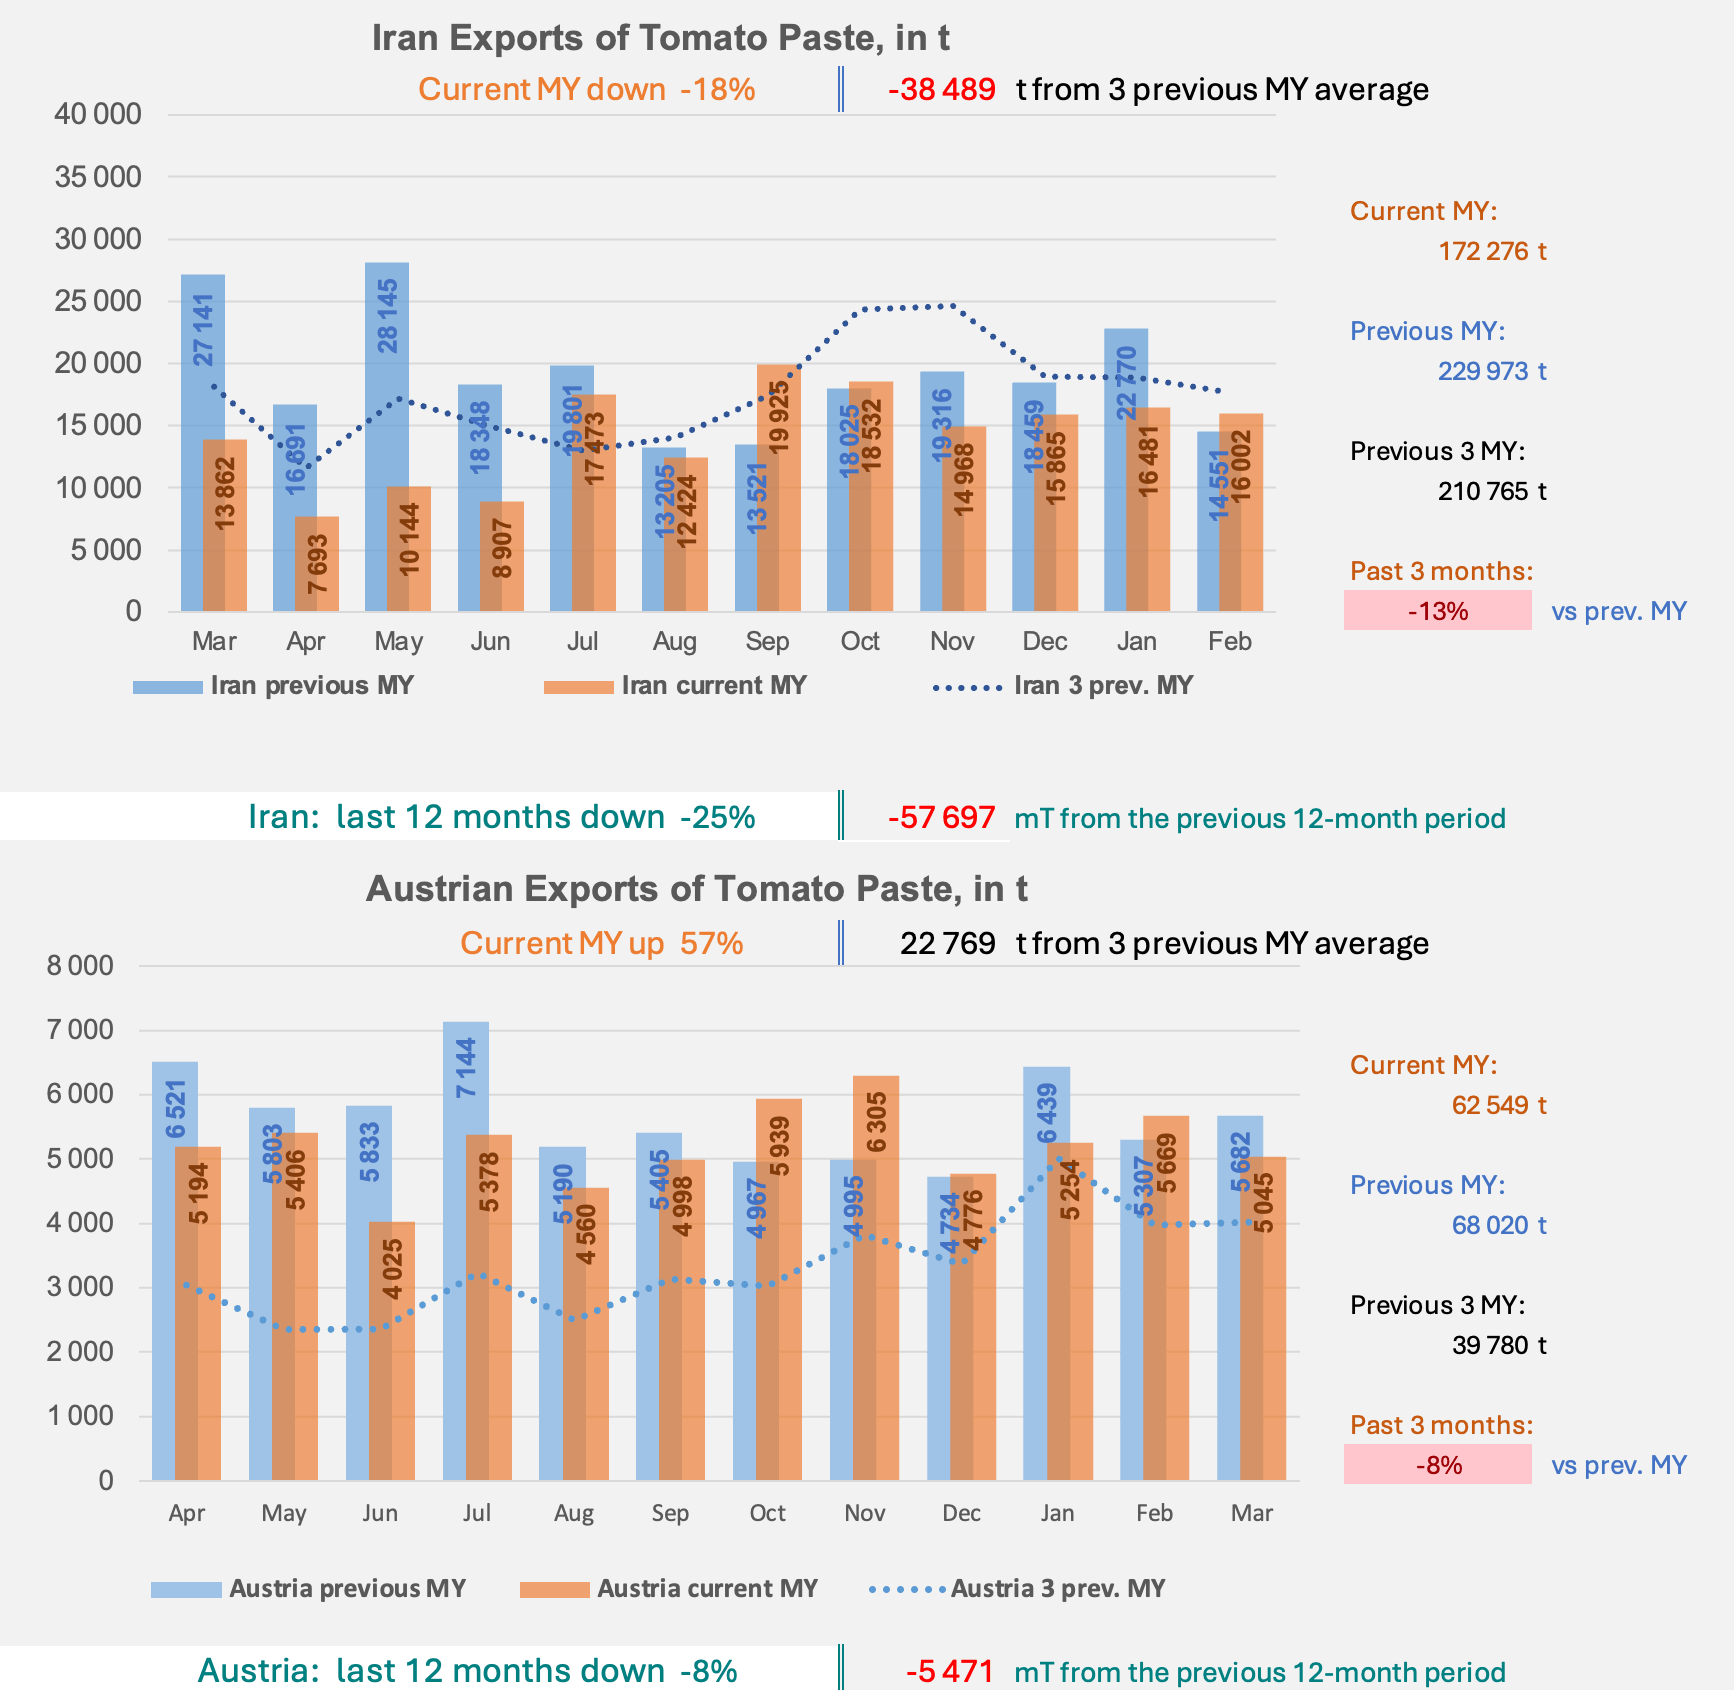
Comparison of monthly exports of tomato paste (HS code 200290) over past two years, comparison with the previous three marketing years (March – February periods)
The latest available data on global exports over the full marketing year (March 2025 – February 2026) show that the pace of trade is under (-0.53%) that of the previous period. This rhythm maintains the total global exports recorded over a 12-month period just above 3.84 million metric tonnes (t) (see complementary information).
N.B.: In the absence of information for Iran in February, the quantity for Iran has been extrapolated in Excel based on the last 2 years.
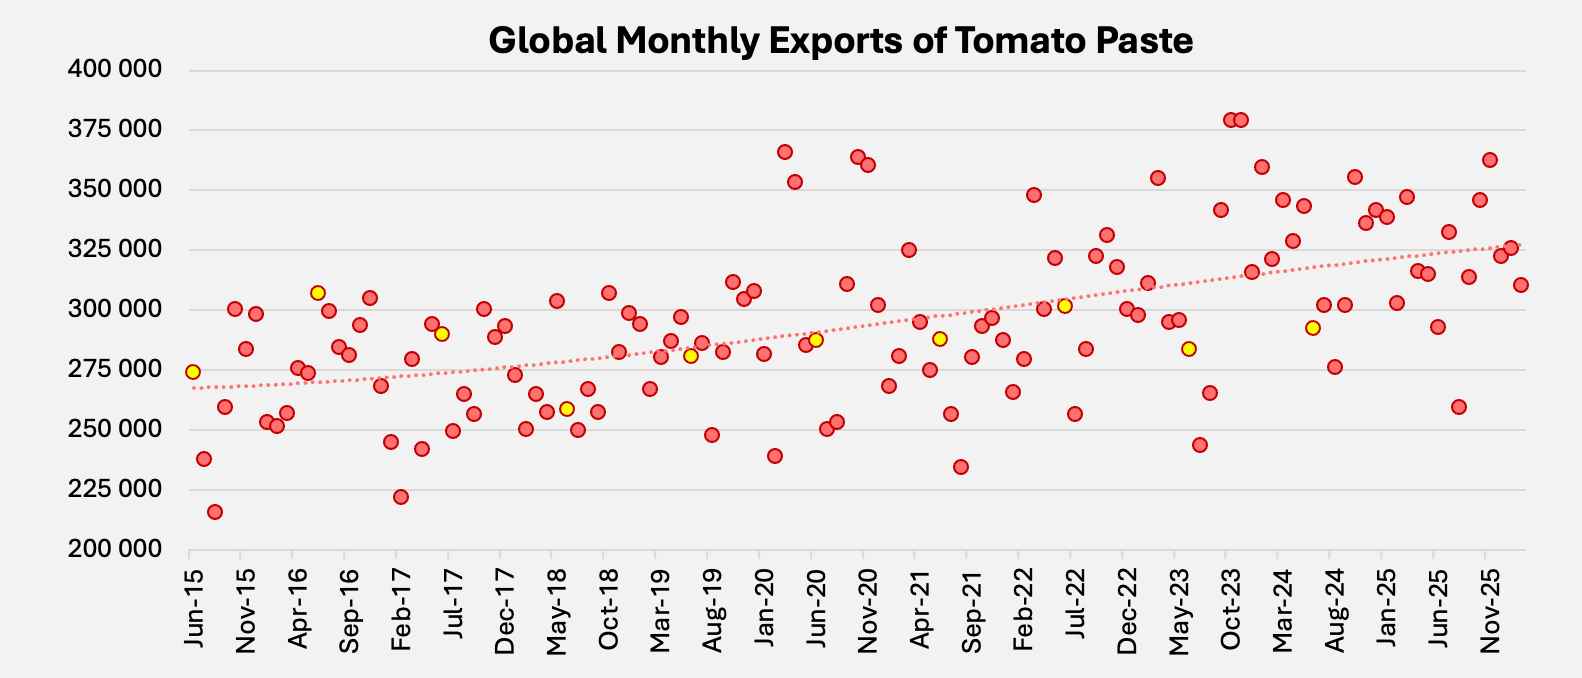
With a total quantity of just above 3.52 million tonnes of tomato paste exported over the period March 2025 – February 2026, TOP10 annual exports of tomato paste were lower (-1.3%, around 47,201 t) than in the previous twelve months (March 2024 – February 2025).
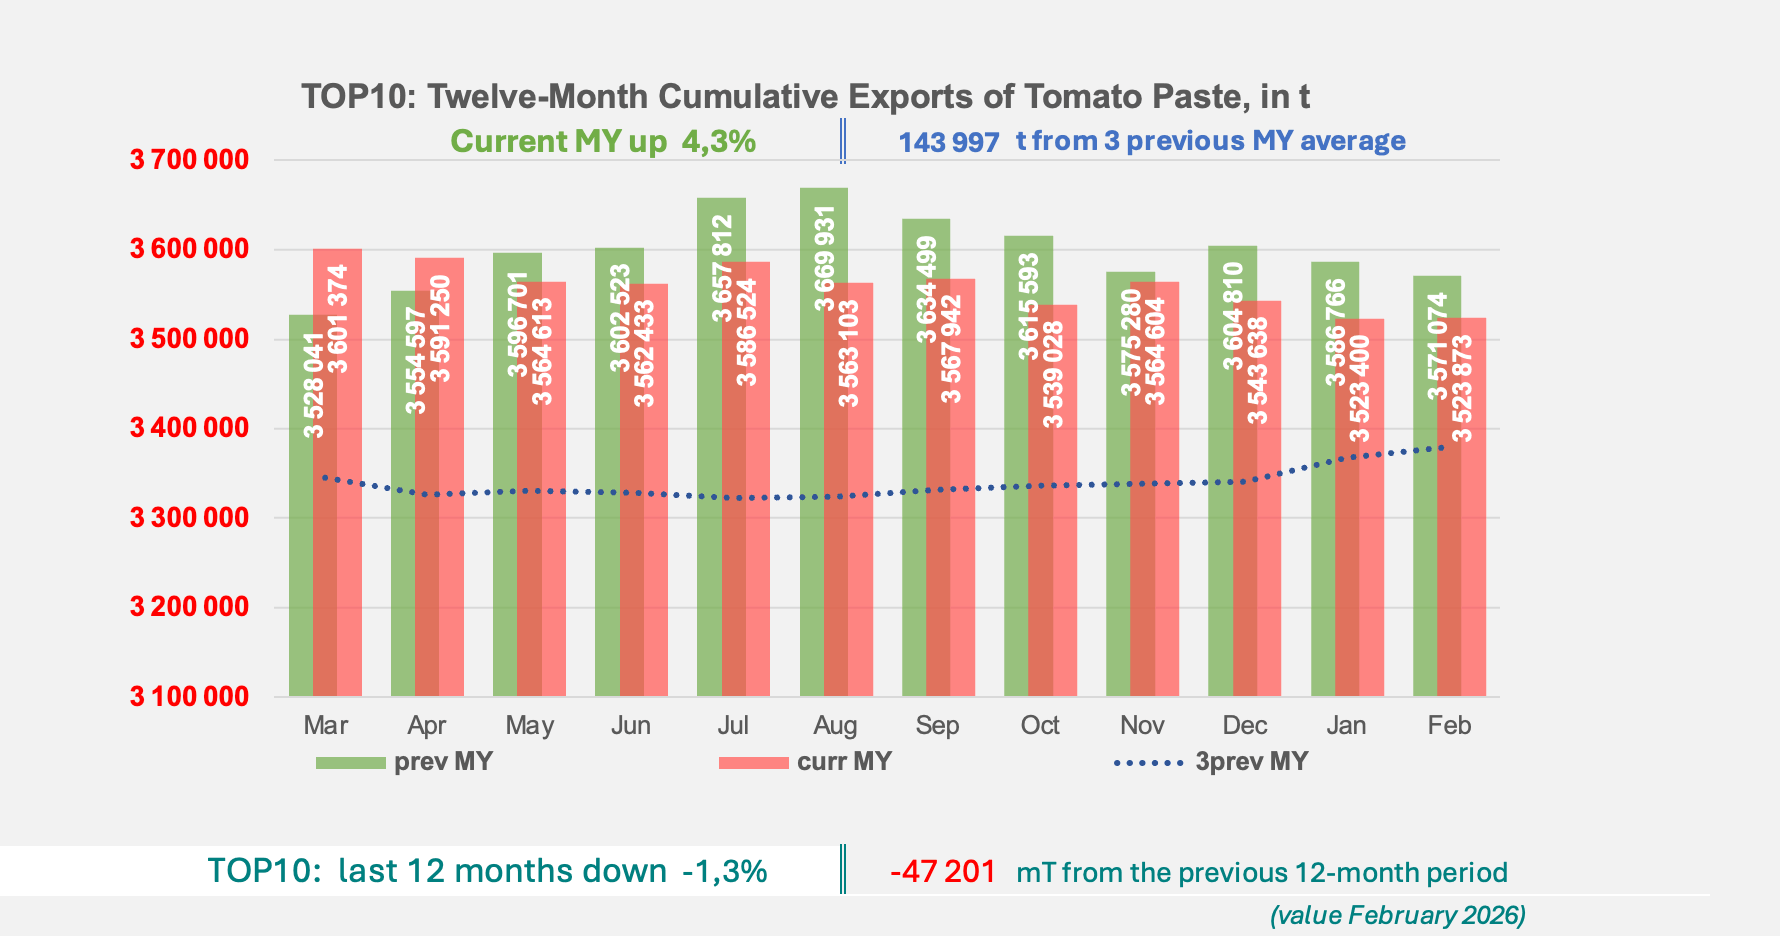
The ten countries presented accounted for 92% of the sector’s total exports on average over the last five years, with the remaining 8% distributed over approximately 80 countries.
For each of the ten countries (China, Italy, Spain, USA, Portugal, Chile, Turkey, Greece, Iran and Austria) that play a significant role in international trade, Tomato News presents a comparison of the monthly performances for exports of tomato paste over past two years. For greater clarity, the histograms present (blue dotted lines) the curve of the average activity of the same months of the three previous marketing years.
This situation makes it possible to follow the evolution of national export dynamics and to compare recent performances with those of equivalent periods of the previous year. These elements of international trade also give a better understanding of the quantities on which the average values presented in our articles on tomato paste prices were constructed.
Complementary information
Sources: Trade Data Monitor LLC, professional sources


