News
China-EU: sharply declining flows
Over the past few decades, the Chinese tomato paste industry deeply reorganized its global trade flows. While the European Union was historically a major outlet, its share has eroded significantly in favor of a massive redeployment toward West Africa and the Middle East, which have become the drivers of Chinese growth. This dynamic reflects the rise of high-demand emerging markets and Europe’s shift toward local or neighboring sourcing, relegating the Chinese product to a fluctuating supplemental role.
Between 2017 and 2026, Chinese tomato pastes exports (HS code 200290) (examined over October-September periods) rose from 885,099 metric tons to 1,210,467 metric tons, marking an overall increase of 36.8% (i.e., a compound annual growth rate / CAGR of 4.0%). This expansion accelerated particularly from 2022 onward, driven by strong global demand.
West Africa, China’s primary outlet, experienced an impressive dynamic: its imported volumes increased by 26.7% over the period (CAGR of 3.0%), with a dramatic surge of +64% since the 2022/2023 low point to reach a record 427,762 metric tons.
The Middle East recorded the strongest growth among major markets, posting a 143.8% surge (CAGR of 11.8%). The region peaked at over 367,000 metric tons in 2023/2024 before receding slightly.
The European Union showed a highly contrasted trend: averaging close to 66,000 metric tons over the last two periods (October 2024 to September 2026), Western EU purchases of Chinese paste grew by 29.4% over ten years, despite a sharp downturn following its 2022/2023 peak, where volumes had more than tripled compared to 2017. Meanwhile, Eastern EU recorded an overall increase of 71.6% (CAGR of 7.0%).
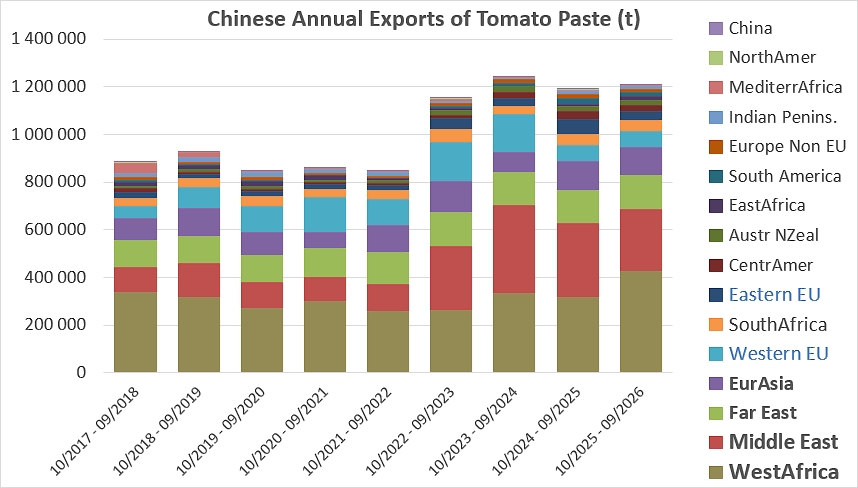
On the side of fast-expanding markets, South America stood out with a 108% surge (CAGR of 9.6%), while Australia / New Zealand more than doubled its shipments (+115.7%, CAGR of 10.1%). The Far East remained a highly stable market with a moderate increase of 29.0%. Conversely, Mediterranean Africa suffered a near-total collapse in volumes (-91.1%), and the Indian Peninsula declined by -19.7%. This geographic redeployment confirms the massive anchoring of Chinese tomato paste in African and Middle Eastern markets.
Over a broader perspective from 2007 to 2026 (10/2007–09/2008 to 10/2025–09/2026 marketing years), Chinese tomato paste exports (HS code 200290) increased from 805,955 metric tons to 1,210,467 metric tons, recording an overall rise of 50.2% (a CAGR of 2.3% over 18 years). However, the trajectory was marked by severe fluctuations: after a first peak above 1.14 million metric tons in 2011/2012, volumes fell to a low of 814,425 metric tons in 2016/2017, before beginning a dramatic recovery toward an all-time high of 1,242,715 metric tons in 2023/2024.
The European Union (EU27) particularly reflects this instability. Over the full period, its imports from China dropped by -39.4% (from 173,265 metric tons to 105,035 metric tons, representing a CAGR of -2.7%). Western EU was the main driver of this drop, suffering a -48.3% collapse (CAGR of -3.6%) and falling to an all-time low of 31,337 metric tons in 2013/2014 after nearly touching 198,000 metric tons in 2009/2010. Conversely, Eastern EU showed a more contained erosion of -15.1%, holding at around 39,600 metric tons at the end of the period despite a temporary peak near 79,300 metric tons in 2009/2010.
Non-EU Europe, mainly driven by UK activity, followed a similar clear declining trend, plummeting by -43.6% over 18 years (from 25,573 metric tons to 14,429 metric tons, CAGR of -3.1%).
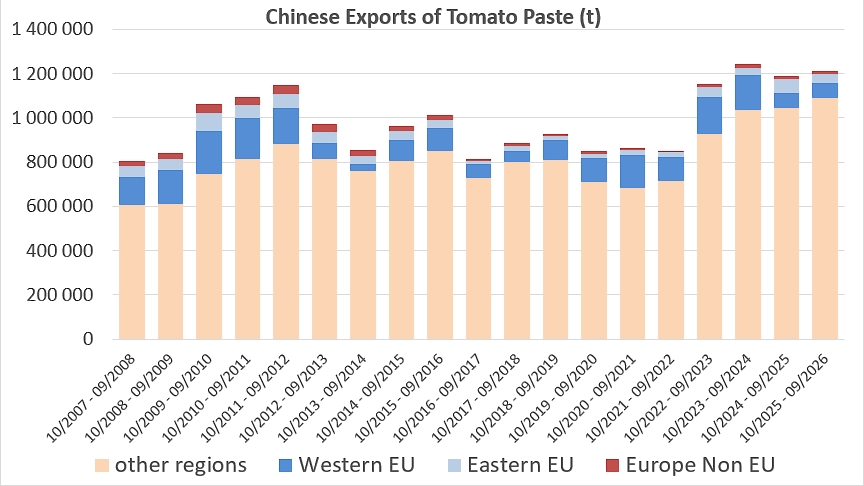
The real engine of Chinese growth rests on the “other regions of the world” category (Africa, Middle East, Asia, South America, etc.). Their volumes surged by 79.7% over the entire period (rising from 607,122 metric tons to 1,091,006 metric tons, CAGR of 3.3%). Accounting for over 90% of total Chinese exports today, these emerging markets largely compensated for the structural decline in shipments to the European continent.
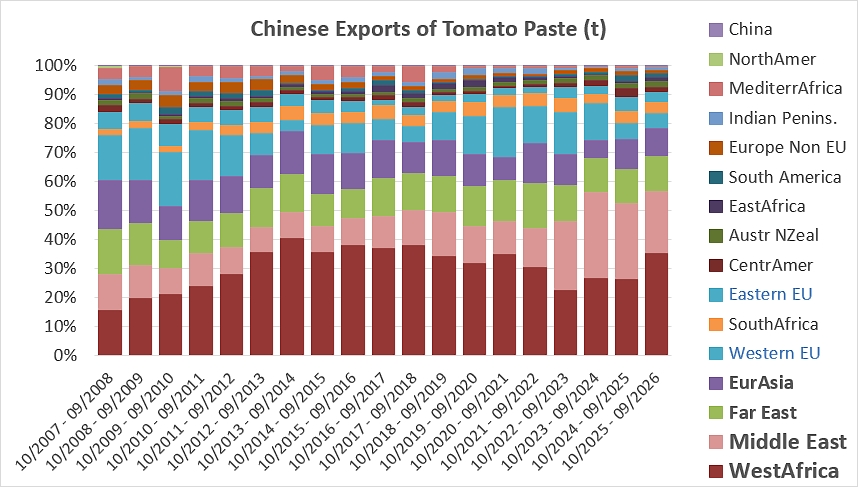
Between 2007 and 2026, the geographical breakdown of Chinese tomato paste exports shifted massively toward Africa and the Middle East, at the expense of European markets. West Africa became China’s top destination, seeing its share leap from 15% to over 35% of total Chinese sales worldwide. The Middle East also established itself as a vital pillar, capturing 20% to 30% of recent flows compared to 12% originally. Conversely, purchases by Western EU collapsed, falling from nearly 20% of volumes mobilized by Chinese actors to just 5% to 8% today. Finally, the Far East and Eurasia maintain a stable weight of around 10% to 15% each, completing the map of Chinese outlets.
Over the past ten years, Chinese tomato paste exports to the European Union experienced an overall trend that was both downward and highly volatile. After a marked increase in the middle of the period, pushing the European total from an initial level of around 73,600 metric tons to peaks exceeding 210,000 metric tons in 2022/2023, volumes readjusted sharply to settle at 105,035 metric tons in 2025/2026. Over the entire cycle, total exports to the EU nevertheless grew by nearly 43% (a CAGR of 4.5%).
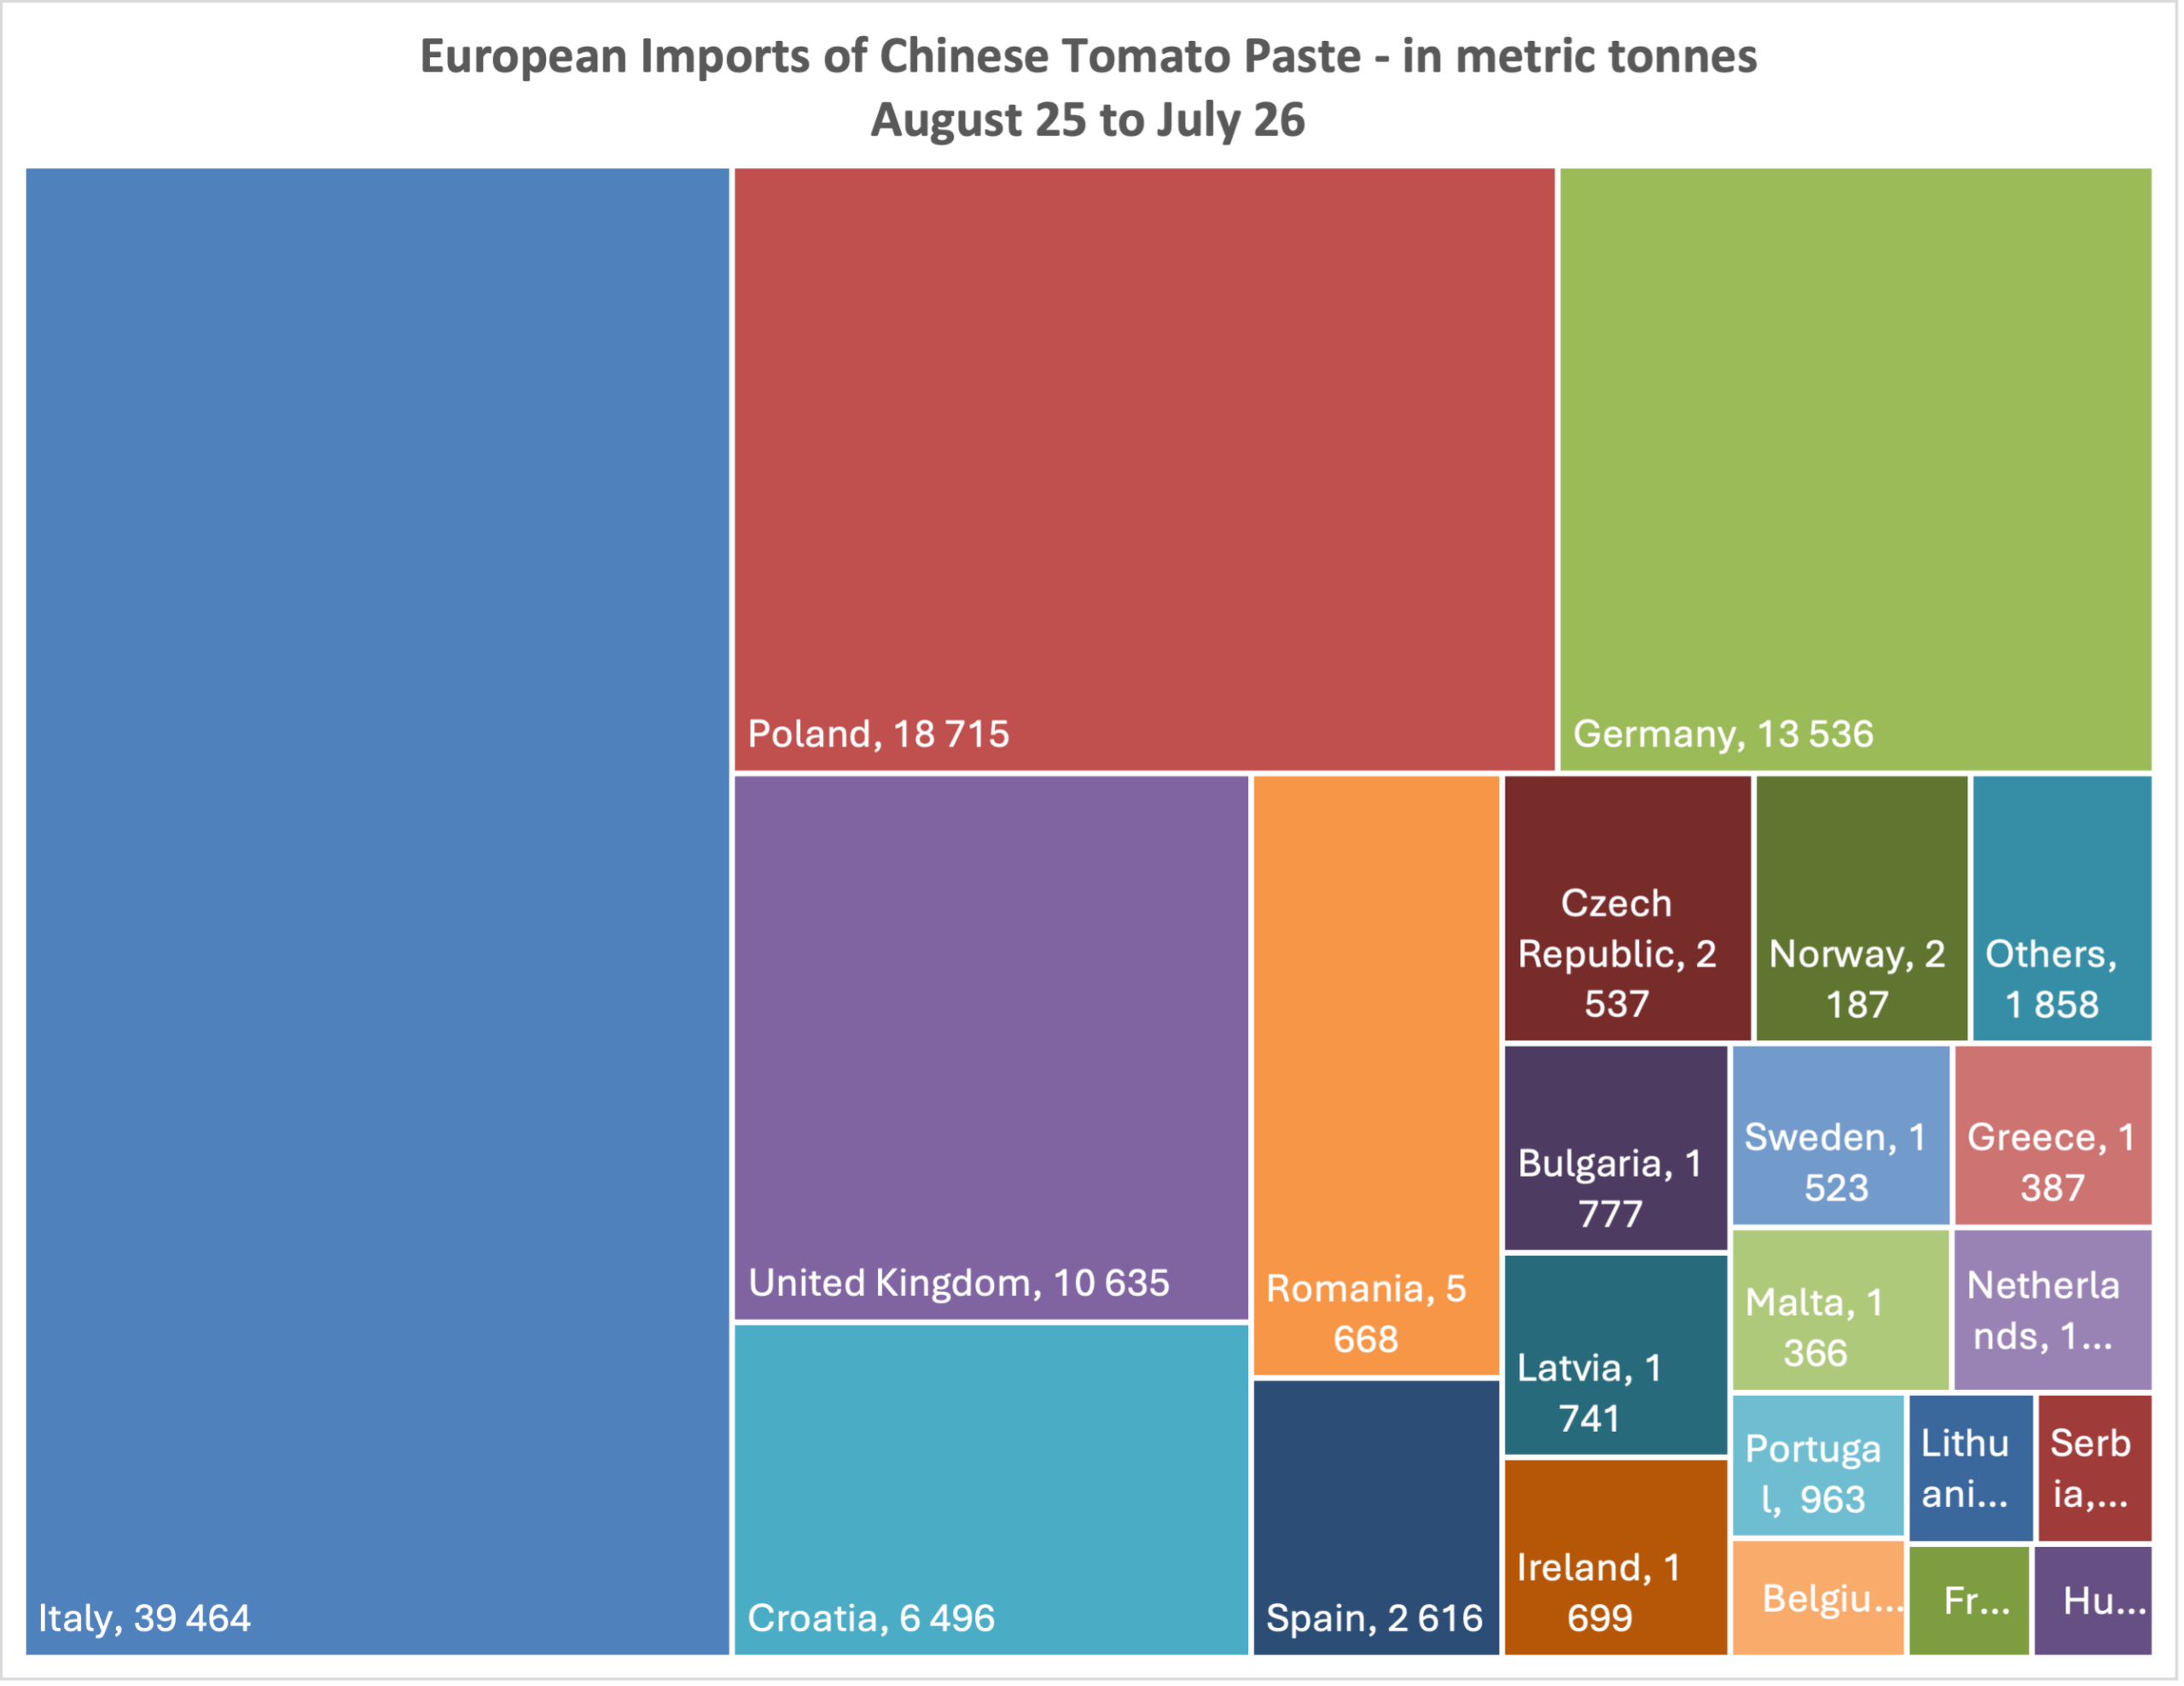
Processing countries continue to weigh heavily in the overall dynamic. While Italy remains the top destination by volume, Poland is strongly driving growth with a doubling of its purchases (+98.9%, CAGR of 9.0%), reaching 19,802 metric tons in 2025/2026 after a peak of over 30,400 metric tons the previous year. Spain also fits into this upward trajectory, albeit to a lesser extent (+181,2%), climbing to 2,342 metric tons after a peak of over 12,000 metric tons in 2022/2023. For its part, Portugal acted as a temporary buffer with significant volumes absorbed mid-period (up to 33,549 metric tons in 2022/2023) before returning to normal levels. Other processors like France, Greece, and Hungary maintain modest, marginal flows.
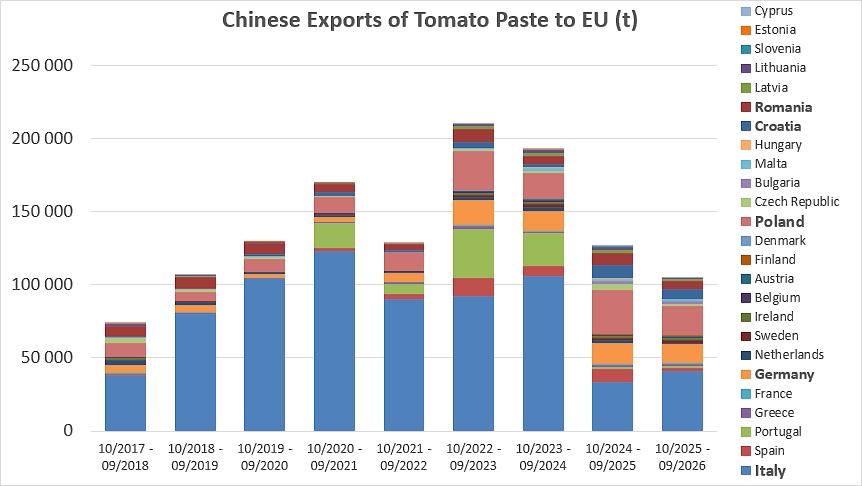
Among non-processing countries, Germany recorded a remarkable progression of +137.9% (CAGR of 11.4%), consolidating its position as a leading consumer market at 13,041 metric tons. Croatia distinguished itself with a spectacular surge (+978.7%) to reach 6,634 metric tons, while Romania held at a high level despite a slight dip of -23.2% to 5,148 metric tons.
EU27 share in Chinese activity
Between 2007 and 2026, the share represented by the European Union (EU27) in Chinese tomato paste exports underwent a remarkable structural decline, dropping from 21.5% of total worldwide exports from the country in 2007/2008 to just 8.7% in 2025/2026, marking a -59.6% drop in its relative share. In the early 2010s, the EU constituted a major historical market for China, regularly accounting for 20% to 26% of all its shipments, with a peak of 26.1% recorded during the 2009/2010 campaign (276,862 metric tons out of a total 1,062,236 metric tons exported by China). A first shift occurred between 2012 and 2015, with the European share falling to a historic low of 8.0% in 2013/2014 (68,307 metric tons out of 853,214 metric tons).
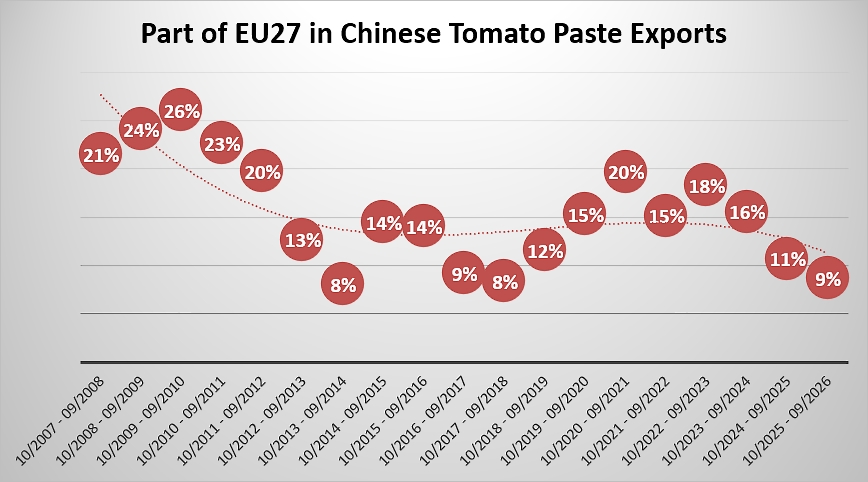
Following a marked rebound phase at the turn of the 2010s/2020s—where the EU share climbed back up to 19.7% in 2020/2021 then 18.3% in 2022/2023 (with a volume peak at 210,407 metric tons)—European flows once again contracted sharply. Over the last three marketing years, the EU share fell successively to 15.5%, then 10.7%, finally dropping below the 9% mark. This relative share decline (-3.8 percentage points per year on a weighted average over 18 years) illustrates the previously mentioned massive redeployment of Chinese exports toward other fast-growing global destinations (West Africa, Middle East, Asia), making Europe a less strategic, more occasional, and targeted market in China’s overall sales geography.
Share of Chinese products in European imports
Although several countries have not yet reported their recent customs data, the information collected for the August–July periods shows long-term relative stability in the share of Chinese products within total global imports. This share has historically fluctuated between 21% and 33%, finally standing at 23% for the period from August 2025 to July 2026.
However, this apparent continuity at the global level conceals profound changes and highly contrasting trajectories across different geographical areas, particularly within the European region, where a very sharp decline is observed. While China supplied a quarter of European tomato paste imports in 2007/2008, its share collapsed to a low of 6% between 2016 and 2019. Despite a temporary rebound to 15% during the 2021/2022 campaign, the market share of the Chinese supplier contracted again to settle at 8% in 2025/2026, marking a major overall disengagement from the European market.
A detailed analysis by sub-region reveals distinct dynamics. Eastern Europe represents the area where the Chinese market share was the highest, but also the most volatile. Accounting for 37% of the region’s imports in 2007/2008, it reached an all-time high of 47% in 2010/2011. A sharp downturn subsequently brought it down to its lowest level (5%) in 2020/2021. However, this trend reversed under the impetus of increased purchases of Chinese processed products by Poland, Romania, the Czech Republic, and, to a lesser extent, Slovenia, Latvia, Hungary, Bulgaria, and Malta. As a result, the Chinese share of regional imports climbed back to 19% in 2021/2022 and 23% in 2024/2025, before stabilizing at 19% in 2025/2026, confirming that Eastern Europe remains China’s main foothold on the continent.
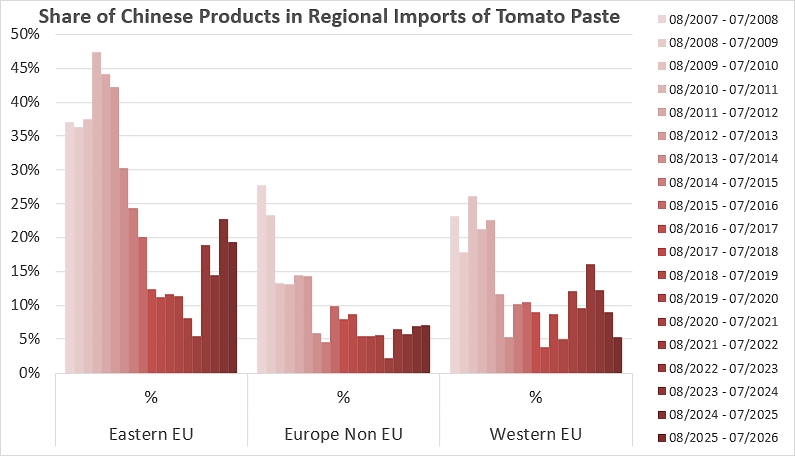
Non-EU Europe, for its part, records an almost continuous decline. Estimated at 28% of imports in 2007/2008, the Chinese share in this region dropped to 13% as early as 2009/2010. Following a brief period of stabilization around 14%, it fell below the 10% threshold starting in 2013/2014. After hitting an all-time low of 2% in 2020/2021, the share of Chinese products in British, Bosnian, and Norwegian purchases settled between 6% and 7%, ending at 7% in 2025/2026.
Western Europe also displays a structural decline in its dependence. While China accounted for 23% of imports at the beginning of the period and still held 23% in 2011/2012, its share fell to 5% in 2013/2014, before ranging modestly between 4% and 12% in the late 2010s. A short-lived surge to 16% in 2021/2022 quickly gave way to a progressive retreat down to 5% in 2025/2026.
This decline in China’s relative weight illustrates a massive and structural shift by European buyers toward alternative sourcing origins. In striving to reduce their reliance on these flows and secure their supply chains, EU processors have increasingly prioritized intra-EU purchases (notably from Italy, Spain, or Portugal) or turned to emerging neighbor suppliers (such as Turkey or Egypt). Consequently, Chinese tomato paste no longer serves as a systematic baseline supply, but rather as a swing source used flexibly depending on domestic harvest performance and price competitiveness gaps.
Source: TDM