The trade deficit continues to widen, but at a slower pace
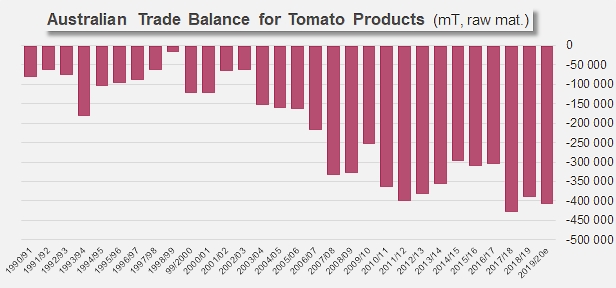
In our previous analysis of Australian supplies in 2017, just as a lively debate about the flow of tomato products from Italy was coming to an end, Australian customs statistics highlighted a reasoned reduction in the deficit of the sector’s trade balance (see our articles in the appendix), reflecting a dynamic recovery in operations (which had been strongly impacted by climatic conditions in 2011) and testifying to a degree of effectiveness of Australian policies regarding imports of foreign tomato products: in 2016, the Australian trade balance was reported to have an estimated deficit of around 310 000 metric tonnes (raw tomato equivalent)
It is clear that the 2019/2020 marketing year confirms this trend, with import flows that are limited or in the process of being contained in terms of quantities, and total annual expenditure that has been practically stable around an average of close on USD 112 million for most of the past ten years. The last few years have been marked by relatively large variations in processing activity, linked to adverse weather episodes, in a general context of slow decline in demand. In fact, net imports of tomato products have recorded, notably in the paste sector, significant annual fluctuations, going from less than 24 000 metric tonnes (mT) of finished products over the period 2014-2016 to more than 40 000 mT over the last two full years (2017/2018 and 2018/2019). The trade balances of the other product categories have evolved less erratically over the past six to eight years, with canned tomatoes hovering around a threshold close on 60 000 mT of finished products, while sauces have remained at around 23 000 mT.
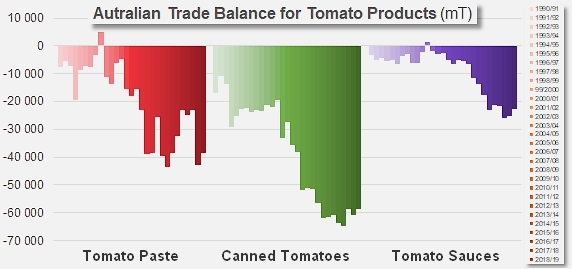
Trade Balance, by category
The trade balances by category in 2019/2020 (with estimations based on the results of the first ten months of the marketing year) are expected to be a continuation of the last two years. At the time of writing this article, the “paste” balance was heading towards a deficit of around 40 000 mT of products, while the “canned tomatoes” and “sauces” trade results practically reproduced the previous performances (59 000 mT and 24 000 mT respectively).
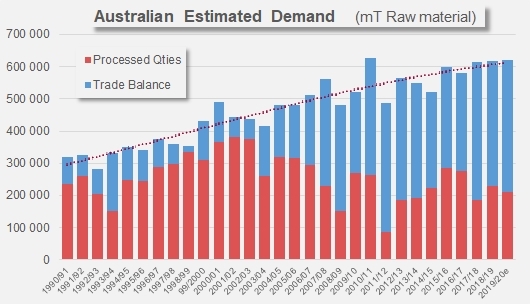
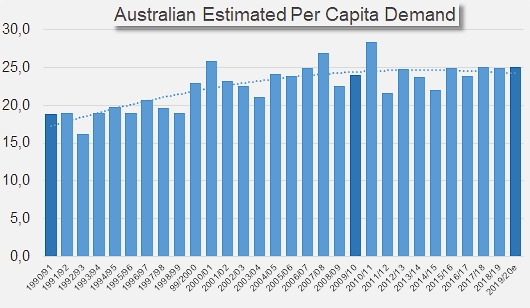
The demand that these supplies are striving to satisfy has grown more slowly over the past decade (CAGR 1.7%) than it had during the previous two decades (CAGR 2.6%). According to data provided by the WPTC and Australian customs services, the increase in demand can be estimated at around 11 000 to 13 000 tonnes per year between 1990/1991 and 2009/2010, while it was between 9 500 and 10 500 mT per year between 2010/2011 and the levels projected for the 2019/2020 marketing year. In terms of per capita demand, these thresholds correspond to a maximum of around 28 kg/year/person (raw tomato equivalent) recorded in 2010/2011 and to an average level in recent years slightly below 25 kg/year/person.
Total Australian expenditure for supplies of tomato products has amounted, on average over the last five full marketing years, to just over USD 114 million. Some exports have contributed to lowering the annual invoice, so that the Australian trade balance for tomato products has recorded a deficit during this period of around USD 100 million. Partial data for 2019/2020 suggests that the deficit will have widened slightly this year, to around USD 104 or 105 million.
The bulk of Australian spending is allocated to canned tomatoes, which have absorbed almost half (46%) of the total amount spent in recent years. Imports of pastes represented a small third of the expenditure, while those of sauces accounted for about 22% of the total.
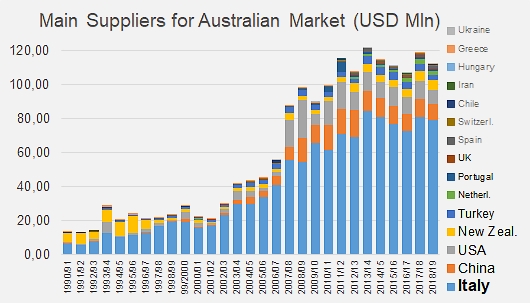
On this basis, it is therefore not surprising to see Italy appearing at the forefront of suppliers to the Australian market, for overall quantities delivered and for the expenditure generated by these supplies, but also for each of the categories served. Over the past three years, Italian products have absorbed 70% of Australian expenditure. Thus, in 2018/2019, out of the USD 113 million spent by Australia to cover its requirements from foreign suppliers, more than USD 45 million were paid for purchases of canned tomatoes of Italian origin, 17.3 million for purchases of sauces from the same source and more than 16.5 million for purchases of pastes from Italy (for a total of USD 79 million).
Over the same period from 2016/2017 to 2018/2019, suppliers in China (mainly active in the pastes and sauces categories), the USA (mainly pastes) and New Zealand (mainly sauces) respectively reported annual turnover results of around USD 10 million, 9.8 million and 5.3 million.
A number of other countries supplied products to the Australian market (Turkey, the Netherlands, Portugal, the United Kingdom, Spain, Chile, etc.), sharing an overall total of slightly less than USD 10 million.
Some complementary data
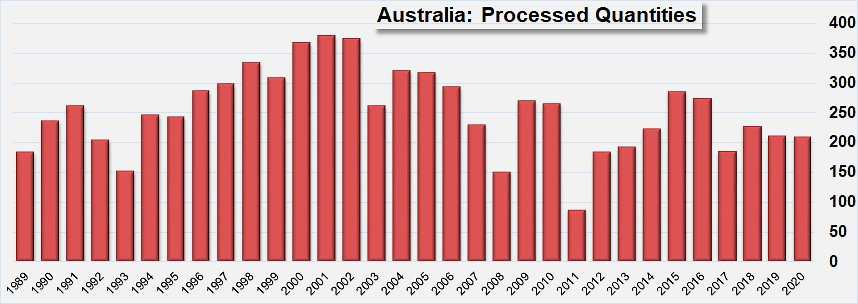
The quantities processed by the Australian industry have gradually decreased over the past two decades, also impacted on several occasions by exceptional adverse weather conditions.
The Australian trade deficit in tomato products continues to widen, but at a slower pace.
Available data shows that the national processing sector currently has the capacity to cover 35 to 40% of the country’s needs, and also indicates a slow growth in demand.
Sources: Trade Data Monitor LLC, WPTC
Further details in attached documents: